

Routine maintenance and health checks
oonfeeWRT is designed as one long-running controller process with bounded storage and adaptive router polling. Routine operation is mainly about preserving recovery material, watching explicit source gaps, and allowing clean shutdown during safety-critical work.
Outcome: You can verify service health, read useful logs, understand automatic retention, adjust polling safely, collect redacted diagnostics, and stop the controller without stranding an Apply.
v0.1.8 workspaces in the maintenance routine
v0.1.8 is the deployment baseline below. Its Precision navigation brings together the investigative screens introduced in v0.1.6 without changing their operational boundaries:
- Use Workspace → Dashboard for fresh fleet evidence, Insights → Statistics for a common historical window, and Insights → Reports for an equal-length comparison. Check observed/expected coverage before interpreting changes or exporting CSV.
- Review Insights → Alerts for active, unknown, and resolved conditions. Unknown evidence is not recovery; a delivery failure is not a router failure. Owners configure rules and opt-in webhooks, while other roles can read them.
- Use Settings → Firmware → Check only when you intend an external catalogue request. Re-probe changed device identity first. No installation runs from this page.
- Use Settings → Integrations for explicit AdGuard or WireGuard observations. Checks are not automatically scheduled, do not configure services, and may require a separately installed/granted read helper for WireGuard.
- Keep the schema-23 recovery unit before upgrading from v0.1.5 to schema 25. Document endpoint changes and external notification destinations as well as router desired state.
The polished topology/inventory views do not improve a missing source by themselves. A browser-local layout can be reset without a router action. If the only goal is UI exploration, use the isolated demo.
Prerequisites and impact
- Read-only access is enough for ordinary health screens.
- Operator access is needed for transient tests such as RF scan and speed test.
- Administrator access is needed for device polling changes and diagnostics.
- Owner access is needed for backup/restore and account custody.
Router write impact: Health endpoints, dashboards, logs, diagnostics, and backups are read-only with respect to routers. Polling makes bounded read calls. RF scans, Apply, ACL refresh, optional LLDP installation/configuration/removal, un-adoption, and resuming post-restore 802.11k maintenance have separately displayed write/disruption impact.
Monitor-only devices use the distinct read-only oonfeewrt-monitor ACL. They remain in polling and topology maintenance, but desired/site configuration, optional LLDP installation/configuration/removal, wireless-neighbour mutation, and other package/config/remove operations are fenced. Existing LLDP observation remains available. Their ACL lifecycle and un-adoption remain explicit maintenance actions. A supported RF scan remains available after a separate disruption acknowledgement. Treat it as an active, transient observation that can interrupt clients, not as passive polling or persistent configuration.
Check controller health
The unauthenticated health endpoint is suitable for local service monitoring:
curl --fail http://127.0.0.1:8080/healthzExpected output:
okThe executable also has a healthcheck mode that reads the configured listen address and checks /healthz:
oonfeewrtd -healthcheckDocker Compose runs that mode every 30 seconds with a five-second timeout and three retries.
A healthy HTTP endpoint means the process is serving. It does not prove that every router, telemetry source, or optional capability is healthy. Use the Dashboard and device detail views for those layers.
Read controller logs
Foreground or service logs
The daemon writes human-readable structured logs to standard error. Read them through the terminal or service manager that starts it.
For Compose:
OONFEE_VERSION=v0.1.8 docker compose logs --tail=200 oonfeewrtTo follow new Compose output:
OONFEE_VERSION=v0.1.8 docker compose logs --follow oonfeewrtRetained private log
The controller also mirrors accepted records into:
<data-dir>/controller.jsonlIt rotates at 2 MiB and retains three rotated segments. Each segment is forced to mode 0600; an individual record larger than 64 KiB is replaced by an omission record.
Do not publish the raw log family casually. Use the diagnostics workflow when sharing support evidence because it bounds and redacts retained content.
Use the application health views
Dashboard
Review:
- online versus total devices;
- wireless and LAN clients;
- five-minute WAN download/upload/ICMP latency/loss history;
- route and fixed-probe provenance;
- missing samples rather than a false zero;
- recent warnings and errors;
- topology evidence summary.
The WAN probe runs only through the managed Gateway, sends exactly three ICMP packets to 1.1.1.1, and runs at most once per minute. It is a fixed reachability observation, not DNS/HTTP validation or a claim of ISP uptime.
The displayed Gateway path is a separate, slower observation. v0.1.3 pairs the installed main-table IPv4 route with OpenWrt logical-interface evidence about every 15 minutes. It supports ordinary DHCP, static, and PPPoE defaults, but is not a rapid failover monitor and does not model policy routing, mwan3, manual WAN selection, per-uplink health, or bond members.
For wired placement, v0.1.4 projects a fresh multi-hop path instead of drawing the same managed device or client directly below every upstream router that saw its MAC. The current projection can hide a possible transit FDB candidate only while the matching direct placement and all required source evidence remain fresh. Raw intervals stay in history, and uncertain candidates return when that proof becomes stale, fails, or closes.
Devices
For each device, review:
- last seen and polling state;
- firmware and capability record;
- current load, memory, clients, and throughput when available;
- degraded/unavailable source explanations;
- management overhead, request rate, observed device CPU cost, bytes sent, and packages recorded as controller-installed;
- current poll interval and scheduled tier.
An unavailable value is not zero. Unknown evidence may come from a denied rpcd call, missing module, failed decode, stale observation, or driver limitation.
Logs
Use General for operational events and Audit for authorized controller actions. Event details retain producer identity, provenance, severity, and supplied network fields. Coverage gaps are part of the result; the controller does not claim history for a source it did not observe.
Two v0.1.4 notices deserve routine attention:
- Exact odhcpd repeat compaction shipped in v0.1.1: repeats share one occurrence-counted row per router-log producer epoch, and startup condenses matching legacy rows. v0.1.4 adds the IPv6 router-advertisement current card, independent of selected filters and page; it names routers, totals occurrences, and links to Review IPv6 and Apply. The banner clears after fresh collection stays quiet, while retained history remains. Verify fresh log coverage before treating an absent banner as resolved.
- The Router clock card appears only for a fresh UTC comparison at least five minutes away from the controller. General events remain ordered by router source time. Correct OpenWrt NTP rather than editing stored events.
An older adoption does not need re-adoption for v0.1.4. Its existing scoped ACL continues ordinary management, but the new luci.getUnixtime read (or luci.getLocaltime fallback) may remain unavailable. Review and approve the updated controller-access payload only when clock status is wanted.
Understand polling behavior
Shipped defaults:
| State | Interval/limit | Meaning |
|---|---|---|
| Baseline | 60 seconds | Always-on device health and history. |
| Focused | 10 seconds | While at least one UI viewer focuses that device. |
| Adaptive maximum | 10 minutes | Backoff ceiling for unavailable or struggling devices. |
| Slow response threshold | 1.5 seconds | Evidence used to widen polling. |
| Load threshold | 5.0 | High one-minute load widens polling. |
Polls are staggered across devices, batched where supported, and completely quiesced during that device's Apply/confirm cycle.
Network and topology discovery, including the effective WAN route, uses a 15-minute cadence even while the device detail view is focused. Missing, malformed, ambiguous, or inconsistent route/interface evidence leaves the current source unavailable and preserves the last proved network cache; it does not guess a new uplink.
Router UTC is a read-only observation folded into a normal successful full poll. The current comparison is held in memory rather than retained as a time series. A failed or denied clock method therefore makes clock status unavailable; it does not invalidate the rest of an otherwise useful poll.
The per-device poll-interval control can make baseline polling slower, not faster than the controller default. Use it for constrained or remote hardware. After saving, the daemon re-registers the device so the new interval takes effect without restart.
Automatic retention
The controller holds raw telemetry in memory temporarily and stores completed rollups in SQLite:
| Data | v0.1.8 retention/bound |
|---|---|
| Five-minute average/min/max/count | 14 days |
| Hourly average/min/max/count | 396 days (13 months) |
| OpenWrt log events | 24 hours; 50,000/device and 100,000 total |
| Controller and audit events | newest 100,000 |
| One event's encoded text/detail | 64 KiB aggregate limit |
| Closed topology intervals | 31 days; active intervals remain |
| RF scans | newest terminal run per device/radio; active work preserved |
| Speed tests | newest three terminal attempts, plus any active test |
| Diagnostic downloads | 15 minutes; up to 20 job records |
| Backup downloads | 15 minutes; up to five job records |
| Restore upload/preview state | 30 minutes; up to five uploads and five previews |
Five-minute rows flush only after a bucket closes. Clean shutdown discards an unfinished in-memory bucket instead of writing a partial canonical row. Do not expect second-by-second raw history after restart.
The engineering envelope is:
- final container image at most 40 MB;
- at most 256 MB steady-state RSS at 25 devices;
- at most 2% of one modern CPU core for an idle fleet;
- at most 2 GB disk at the full retention depth;
- UI bundle at most 1.5 MB gzipped.
These are release engineering bounds, not substitutes for monitoring the host's actual free disk and memory.
Run a controller-host speed test responsibly
The Dashboard speed test:
- runs from the controller process, not a router;
- uses Cloudflare's
https://speed.cloudflare.com/__downand__upendpoints; - transfers approximately 10 MiB down and 5 MiB up;
- is bounded to 30 seconds;
- may temporarily saturate the normal WAN route;
- exposes the controller host's public IP and test requests to Cloudflare;
- measures idle latency/jitter and throughput, not loaded latency/jitter.
The Run action is the plan-bound acknowledgement. Do not schedule repeated tests; v0.1.8 exposes an explicit operator action, not an automatic test loop.
Generate safe diagnostics
Owners and administrators can open Settings → Diagnostics.
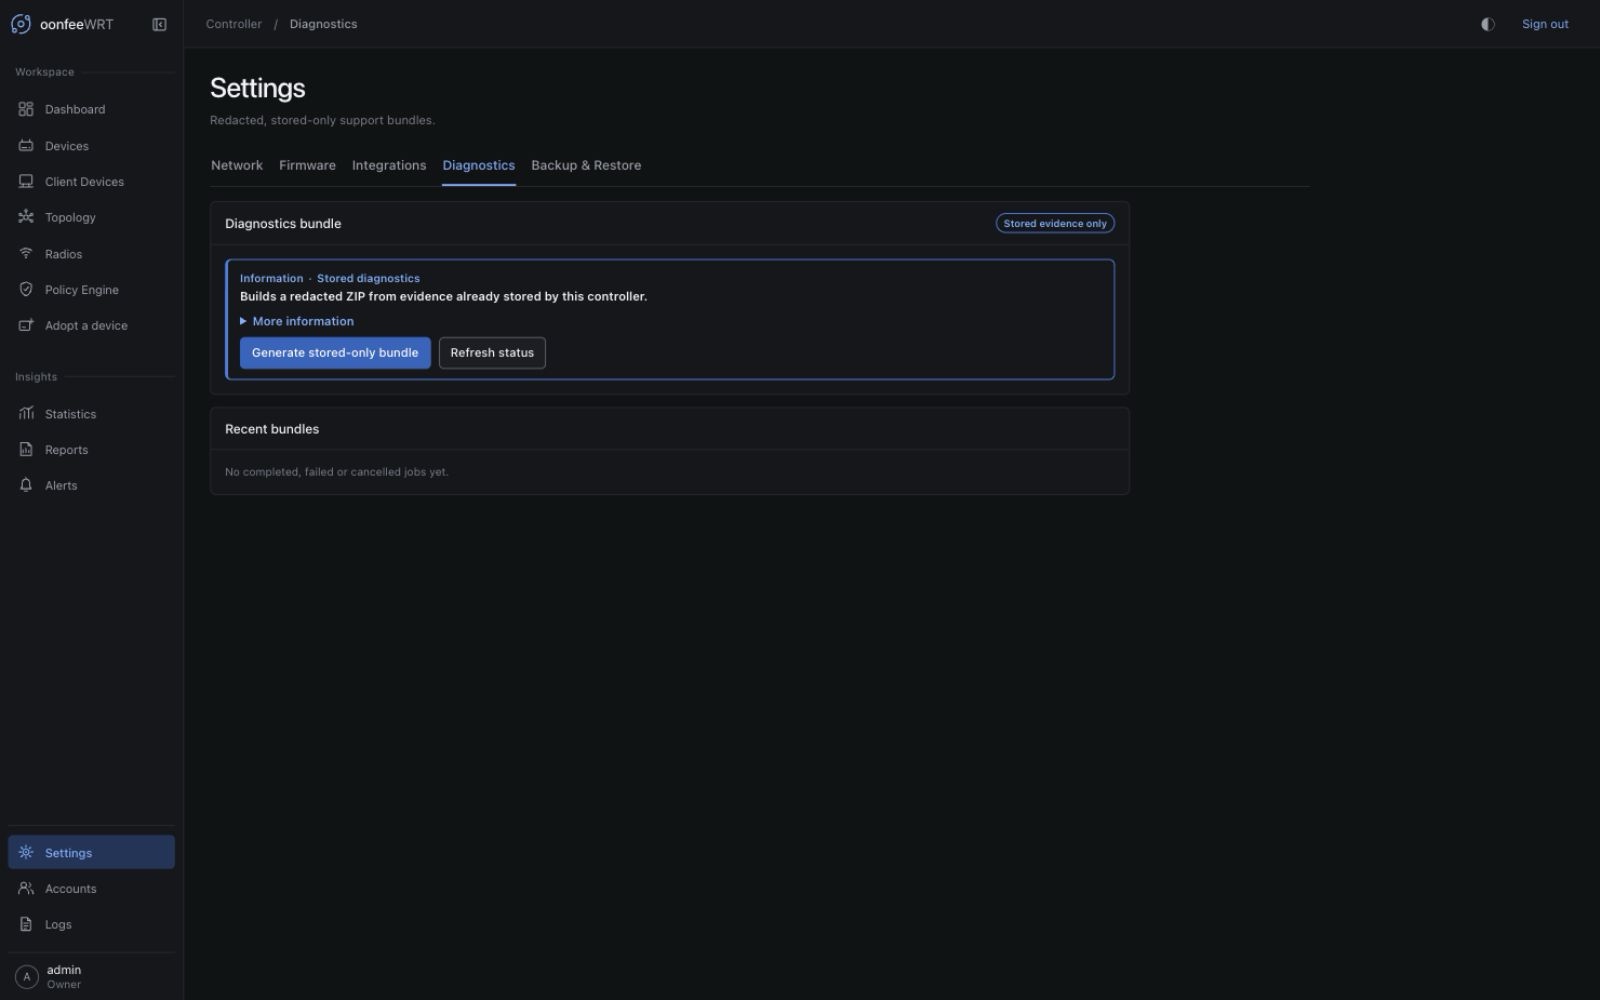
The bundle:
- uses stored controller evidence only;
- makes no router management/API/SSH call;
- includes controller/version/schema/health, stored device model/firmware/capability state, source coverage, bounded events, and a bounded controller log tail;
- pseudonymizes or redacts sensitive identifiers and known secret values;
- excludes credentials, WLAN/mesh keys, private keys, session material, runtime/export passphrases, and raw secret values;
- is bounded to 16 MiB of members plus 1 MiB archive overhead;
- remains downloadable for 15 minutes.
Procedure:
- Open Settings → Diagnostics.
- Read the Stored evidence only disclosure.
- Select Generate stored-only bundle.
- Wait for completion and download the ZIP before expiry.
- Inspect its manifest and contents before sharing it.
Redaction reduces risk; it does not make arbitrary distribution safe. Controller metadata and network structure may remain sensitive.
Shut down safely
The daemon handles SIGINT and SIGTERM. A normal shutdown:
- stops accepting new work;
- waits for admitted requests and controller jobs within bounds;
- lets an Apply that reached OpenWrt's rollback-protected stage continue toward confirm instead of abandoning its timer;
- flushes completed telemetry buckets and discards the incomplete one;
- checkpoints/closes SQLite;
- closes the private log.
For a foreground binary, press Ctrl-C once and wait. A second signal is an emergency termination path, not routine shutdown.
For Compose:
OONFEE_VERSION=v0.1.8 docker compose stopThe supplied service grants 150 seconds. Avoid docker kill during Apply or restore confirmation.
Routine operator checklist
Before configuration work:
- Confirm
/healthzand controller logs are clean. - Confirm the target device is online and source gaps are understood.
- Confirm no restore-based router-write suppression is unexpectedly active.
- Take or verify a recent encrypted backup.
- Preview and read the complete per-device plan.
- Never reuse acknowledgements from an older preview; a changed plan requires new review.
Periodically:
- Download a fresh
.oowrtbakto off-host storage. - Keep its export passphrase separately and run a disposable restore preview.
- Review owner accounts and active sessions.
- Review device firmware/capability freshness and explicit ACL-refresh notices.
- Review active IPv6 conditions with router-log coverage; use Prefix delegation or Disabled only through a fresh Preview and Apply, not by deleting retained events.
- Check Router clock notices. On an older adoption, refresh the ACL only if the named clock-read gap is the missing feature; correct large offsets in OpenWrt NTP settings.
- On PPPoE or multi-uplink sites, compare the Dashboard and topology uplink with the installed main-table route after planned routing changes.
- Check host disk/RAM and the controller data-volume backup.
- Read release notes before changing the daemon or image.
Troubleshooting and recovery
/healthz fails
Check whether the process/container is running, then inspect startup logs. Common causes include passphrase-file permission, wrong runtime passphrase, missing/mismatched keyring, unsupported schema downgrade, data-directory permission, and address/port collision.
Health works but the browser says unavailable
Test the browser route from the same host, then check reverse-proxy routing and certificate state. If REST works but live updates do not, check WebSocket forwarding for /api/v1/live.
One device is offline
Verify management routing and the device's uhttpd/rpcd service. Review certificate/SSH pin changes separately; do not silently accept a changed identity. Default adaptive backoff may wait up to ten minutes after repeated hard failures; an explicitly configured 15-minute baseline remains 15 minutes unless a safe explicit action retriggers contact.
Data is missing or stale
Read the displayed source gap. Do not interpret Unavailable as zero. A stored capability may need explicit reprobe after firmware changes; ACL widening is an explicit reviewed refresh, never a polling side effect.
For missing WAN path or traffic data, distinguish the one-minute ICMP probe from the 15-minute route/interface observation. Equal-metric distinct defaults, ECMP/multipath, policy routing, or a kernel device that cannot map to one active logical interface are intentional evidence gaps. After correcting a normal DHCP/static/PPPoE route, wait for the next network/topology cycle. Upgrading from v0.1.4 to v0.1.8 does not require re-adoption. Existing devices remain Managed and their scoped access keeps ordinary polling and management working. Source-relative MAC provenance begins with the next successful managed-Gateway poll; active MAC intent fails Preview closed until every referenced MAC is observed locally. Router-clock status remains unavailable on an adoption created before v0.1.4 until an Administrator separately reviews and applies the updated controller-access payload.
For an IPv6 condition, distinguish the active card from its retained compact event row. The card depends on recent evidence and a fresh log cursor; a stale or gapped source is unknown, while a historical row can remain after the card clears. Fix the router configuration, then wait for continuous successful log collection instead of deleting evidence.
Apply status is unknown after reload
Use the durable Apply-operation recovery/status view. Do not start a second Apply until the first operation's per-device outcome and possible rollback window are understood.
Disk backup looks smaller or older than expected
Do not trust a live main-file-only SQLite copy. Use .backup, a clean stop, or portable .oowrtbak, and always include the matching keyring.
A container was recreated with an empty controller
Stop before adopting anything. Reattach the original volume and passphrase source. A new empty volume is a separate controller, even when the Compose file is unchanged.