

Visual tour
Use this page to find your way around the controller, then follow the linked guides for the complete workflow. Screenshots show the controller in dark mode, while the documentation itself supports both light and dark themes. Select an image to open its full-resolution version in a new tab.
Which version am I looking at?
These are real development-controller captures from 12 September 2026, using the v0.1.7 release-candidate UI source before tagging, connected to the existing development backend. They document the new frontend, not a finished v0.1.7 release-binary validation. The Precision layout differs from the v0.1.6 binaries and containers; a newer screenshot does not update an installed controller. See the release summary.
Device names, measurements, activity, and empty states belong to this one development environment. They are not default configuration or performance benchmarks. Your available controls also depend on your role, device capabilities, and collected history.
Visible MAC addresses are covered with solid masks for sharing.
Find your way around v0.1.8
The Precision sidebar separates Workspace network tools from Insights: Statistics, Reports, and Alerts. Settings, Accounts, and Logs stay at the bottom, above a compact signed-in profile that also opens Accounts. Firmware and Integrations are tabs inside Settings, not extra sidebar entries. Collapse the desktop sidebar to an icon rail or expand it for labels; the preference is saved for your account in this browser. On mobile, use Open navigation for the full labeled drawer.
Find the right workspace
| I want to… | Open | Illustrated guide |
|---|---|---|
| See current fleet and Internet health | Dashboard | Dashboard and speed tests |
| Compare historical measurements | Insights → Statistics | Statistics |
| Compare periods and export a summary | Insights → Reports | Reports |
| Review sustained conditions and delivery | Insights → Alerts | Alerts |
| See how devices and clients connect | Topology | Clients and topology |
| Review channel information | Radios | Radios and channel planning |
| Inspect a router or AP | Devices, then select a device | Devices |
| Investigate a client | Client Devices, then select a client | Client Observability |
| Manage zones, rules, and reusable objects | Policy Engine | Policy Engine |
| Connect another router or AP | Adopt a device | First adoption |
| Check official firmware metadata | Settings → Firmware | Firmware |
| Review external DNS or VPN observations | Settings → Integrations | Integrations |
| Configure networks, VLANs, and DHCP | Settings → Network | Networks |
| Configure WLANs and AP groups | Settings → Network | Wi-Fi |
| Inspect my sessions or manage users | Accounts | Accounts and roles |
| Read router events or controller audit history | Logs | Logs and diagnostics |
| Prepare a support bundle | Settings → Diagnostics | Diagnostics |
| Export or stage controller recovery | Settings → Backup & Restore | Backup and restore |
For a populated fictional network, follow the isolated demo guide. It is a separate build, not the live environment pictured below. For smaller screens, see Mobile and installed app.
Settings starts at /settings with Network selected. Bookmark a section using the section query value firmware, integrations, diagnostics, or backups (for example, /settings?section=integrations). The old /firmware and /integrations links still open their matching Settings tabs. Back, Forward, and reload preserve the selected section; permissions still apply, and an unavailable privileged section returns to Network without trapping Back.
Start with current health
Dashboard is the starting point for current health. Keep source and freshness labels in view: a missing observation is not the same as a healthy zero. The compact fleet strip keeps labels and scope notes on the left and counts on the right. Shared dividers replace separate card outlines; a small screen rearranges the same metrics rather than dropping their explanations.
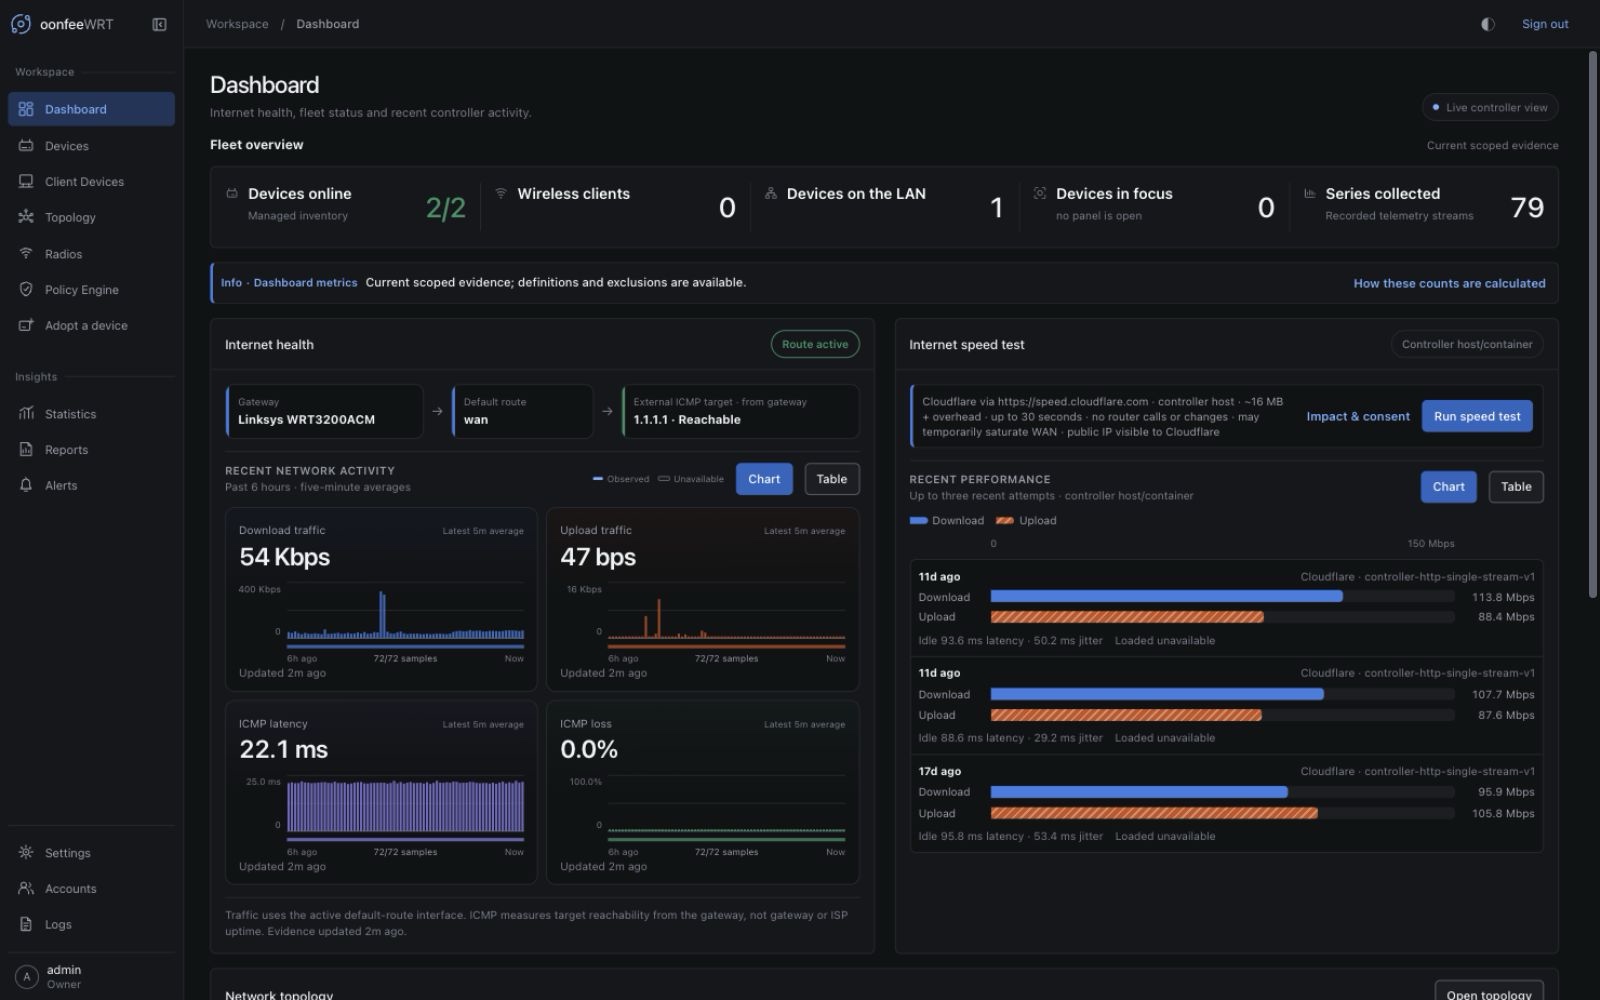
For exact meanings and speed-test limitations, follow the Dashboard guide.
Move from current values to history
Statistics separates current observation from retained history. Start with the time range, check the selected source, and then compare changes across charts. The same page has a device-history section for available system, interface, and radio series.
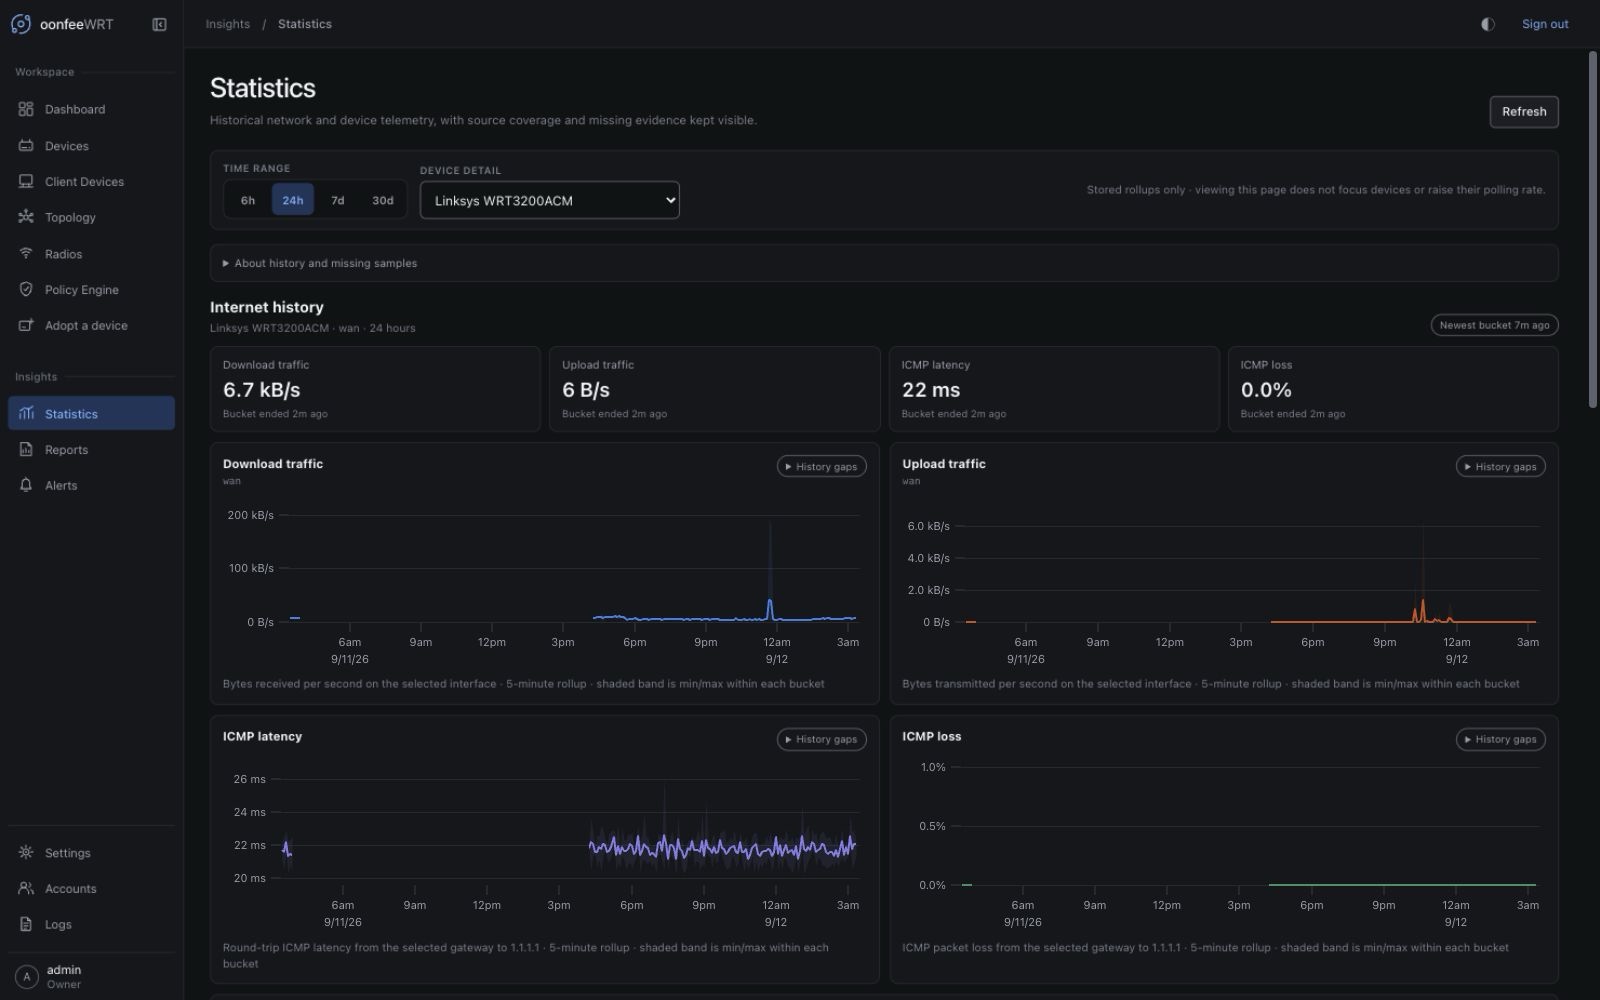
See the illustrated Statistics guide for chart coverage, device selection, and collection limitations.
Compare history and review optional services
These workspaces were introduced in v0.1.6 and remain available in v0.1.8 without making every page a live router operation. Reports reads retained measurements, Alerts evaluates existing evidence, Firmware checks official release metadata, and Integrations contacts an explicitly selected service only when you request a check.
Reports: compare periods with their coverage
Choose a period, review the gateway and observed-interval counts, and compare the summaries with the preceding period. Sparse history remains visibly sparse; missing observations do not become zeros.
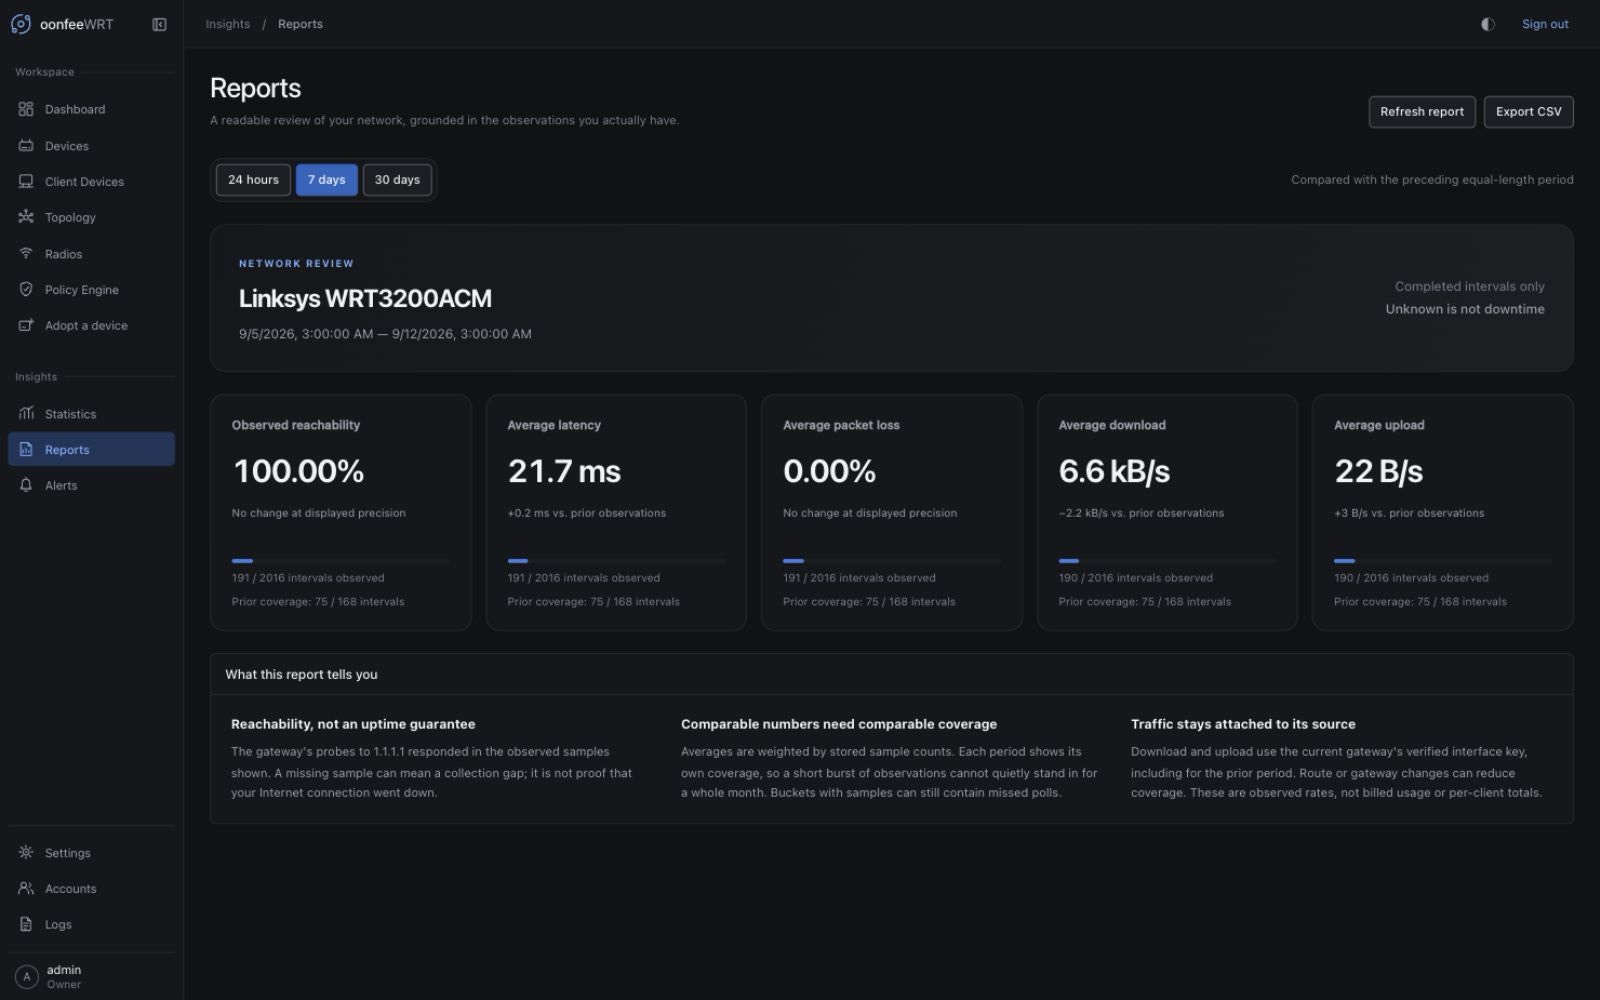
Follow the Reports guide for weighting, period boundaries, gateway changes, and CSV exports.
Alerts: follow sustained conditions
Review rules, current condition states, incidents, and optional delivery in one place. Rule evaluation and external notifications are separate: an Owner must explicitly configure delivery before events can be sent elsewhere.
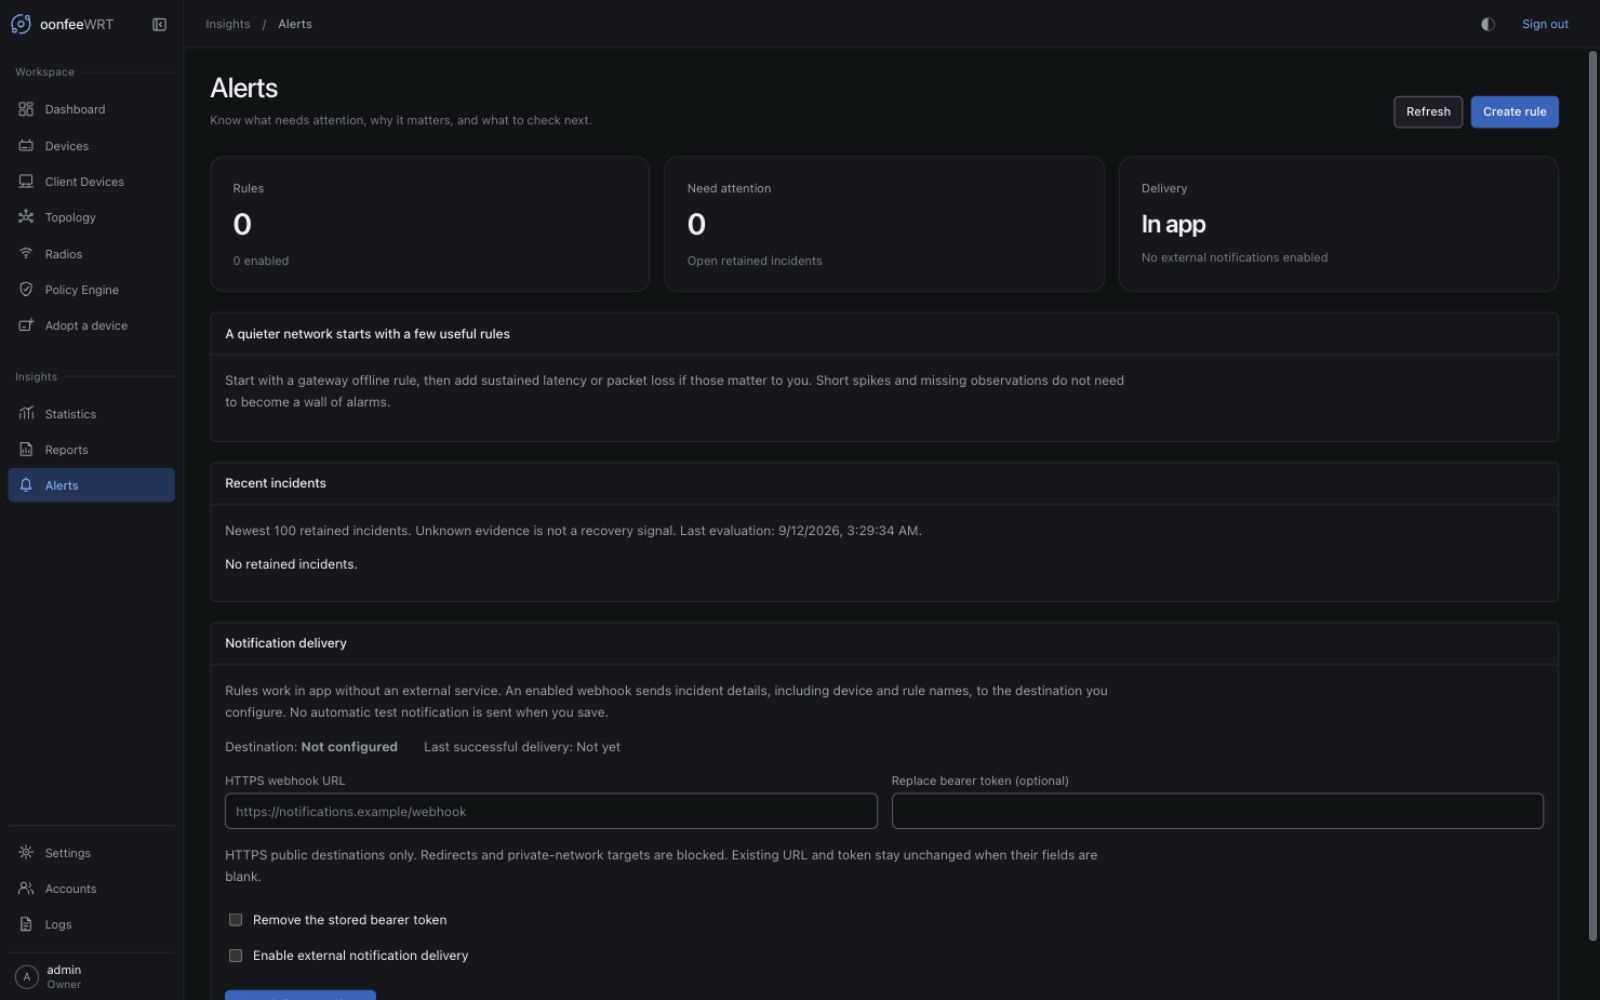
The Alerts guide includes the unsaved rule form, condition requirements, cooldown behavior, and notification boundaries.
Firmware: check a reported version against the catalogue
Open Settings → Firmware, review the device's stored identity, then explicitly request an official same-branch catalogue check. Firmware image selection and firmware installation are not the same operation; this workspace does not flash routers.
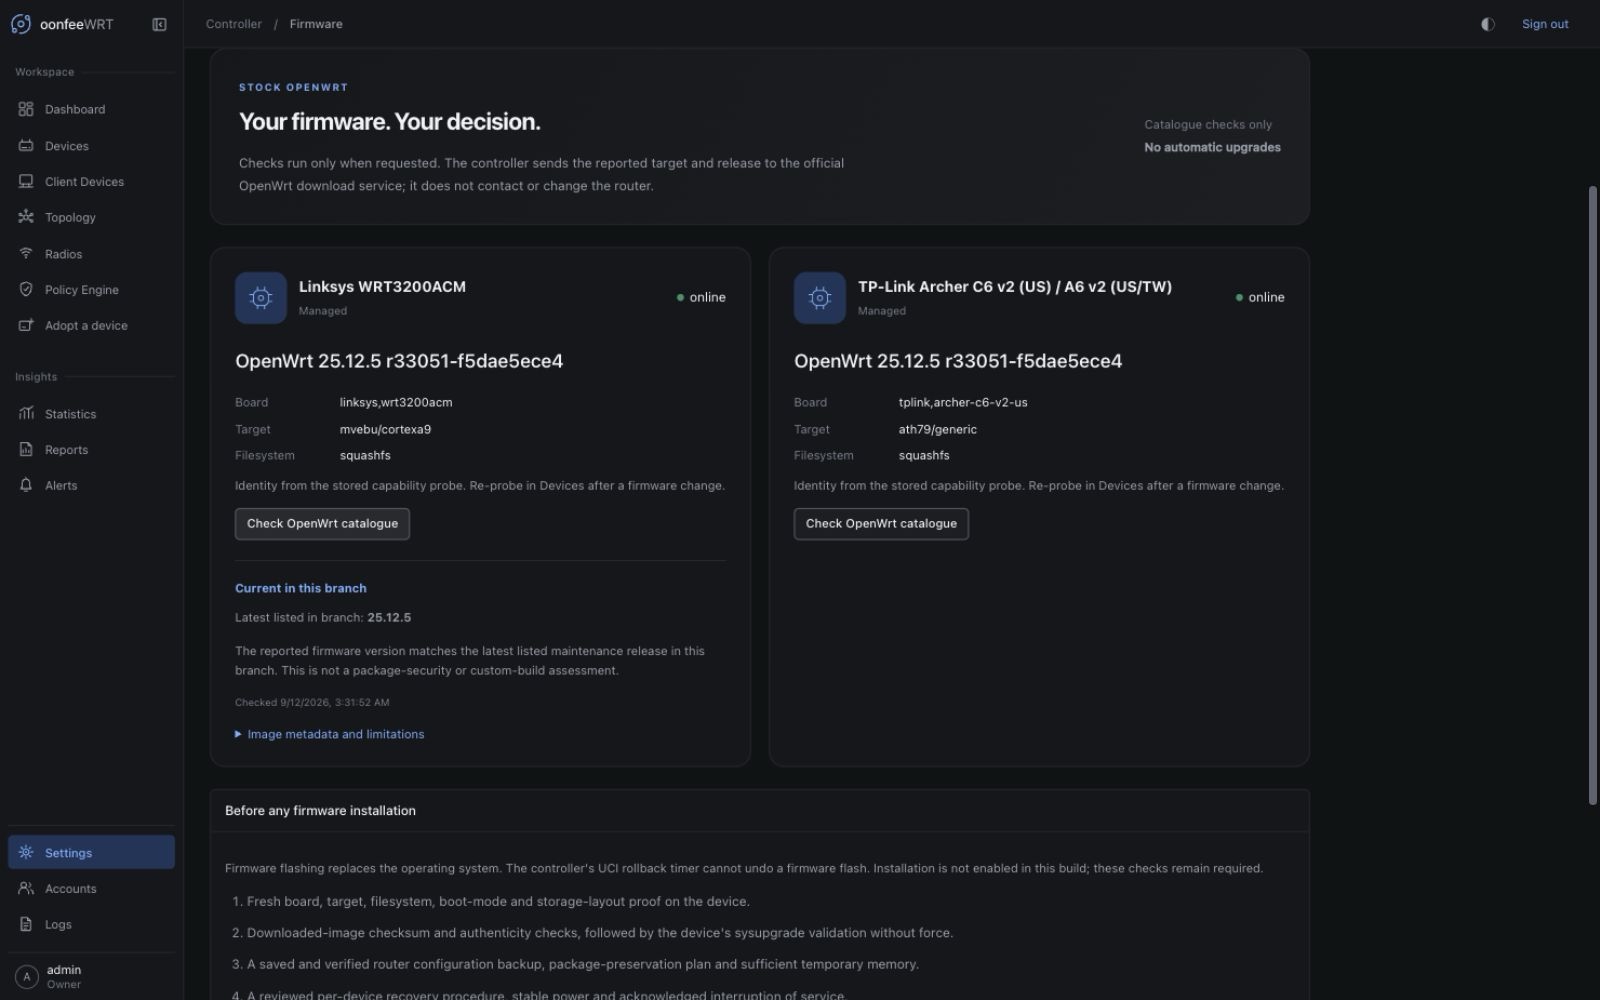
Read the Firmware guide before interpreting a match or considering an external OpenWrt installation workflow.
Integrations: connect only what you intend to inspect
Open Settings → Integrations for optional AdGuard Home and WireGuard read-only visibility. The overview does not invent measurements when no connection or observation exists. Merely opening the page does not configure DNS, install a helper, or create a tunnel.
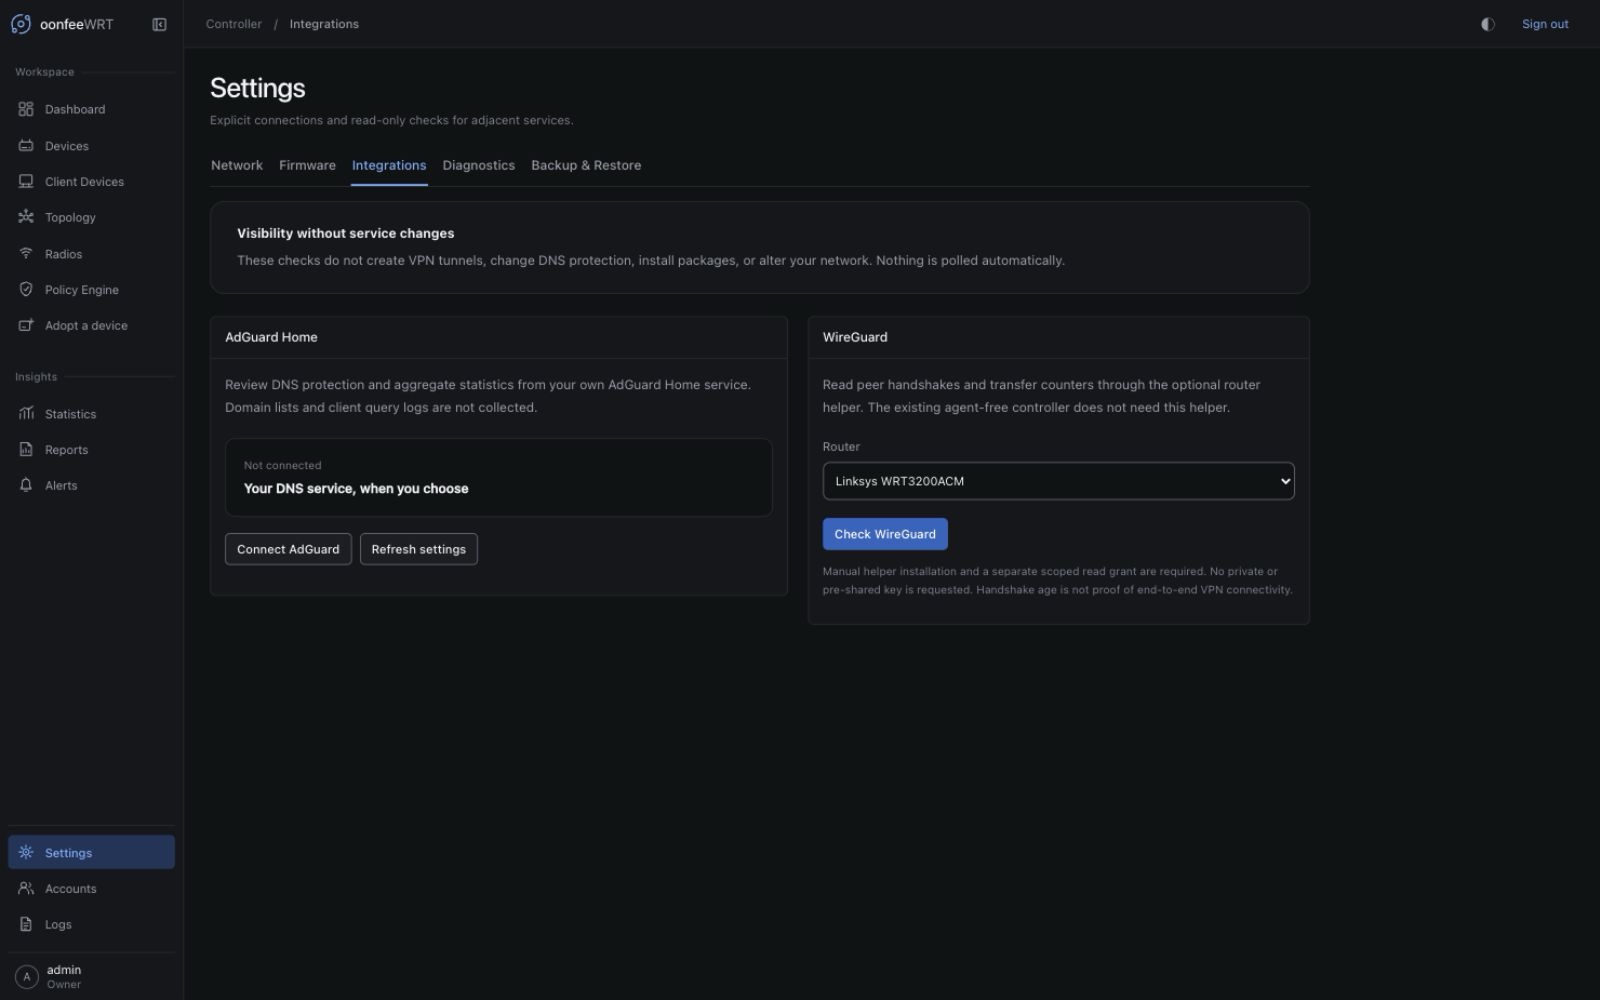
The Integrations guide illustrates the unsaved connection form and explains credentials, permissions, and explicit checks.
Inspect connections and radio evidence
Topology helps explain observed relationships. Client Devices opens a per-client investigation, and Radios shows the channel evidence available for each stable radio. These are complementary views, not a guarantee that every physical link or neighbouring network has been observed.
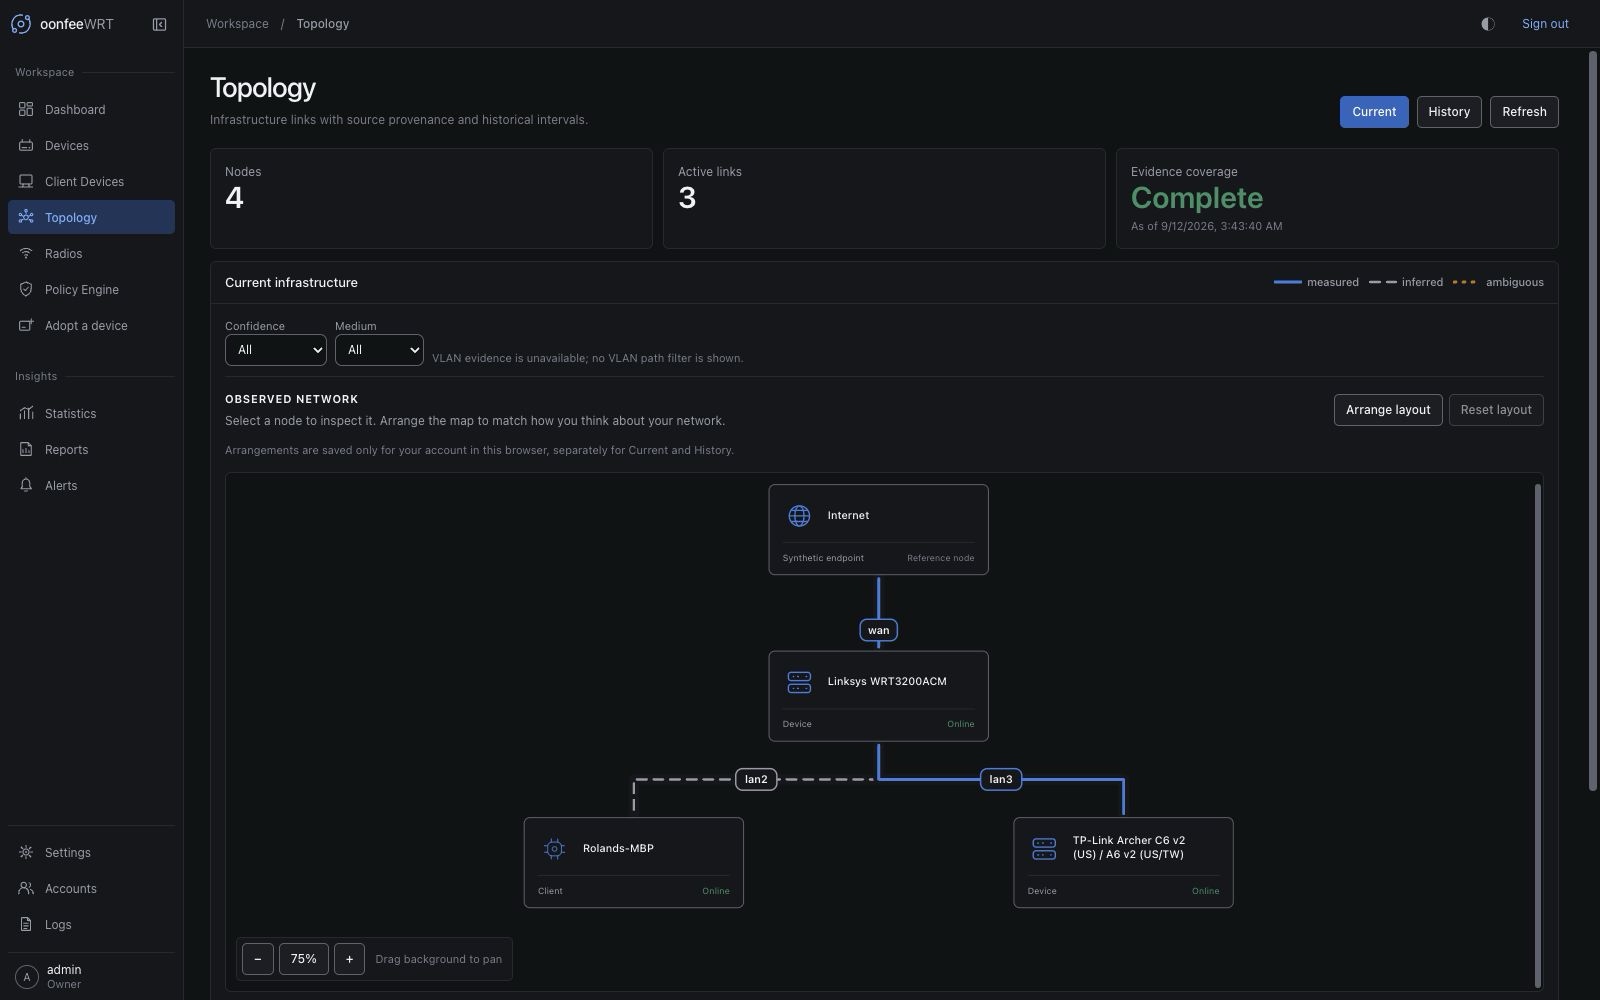
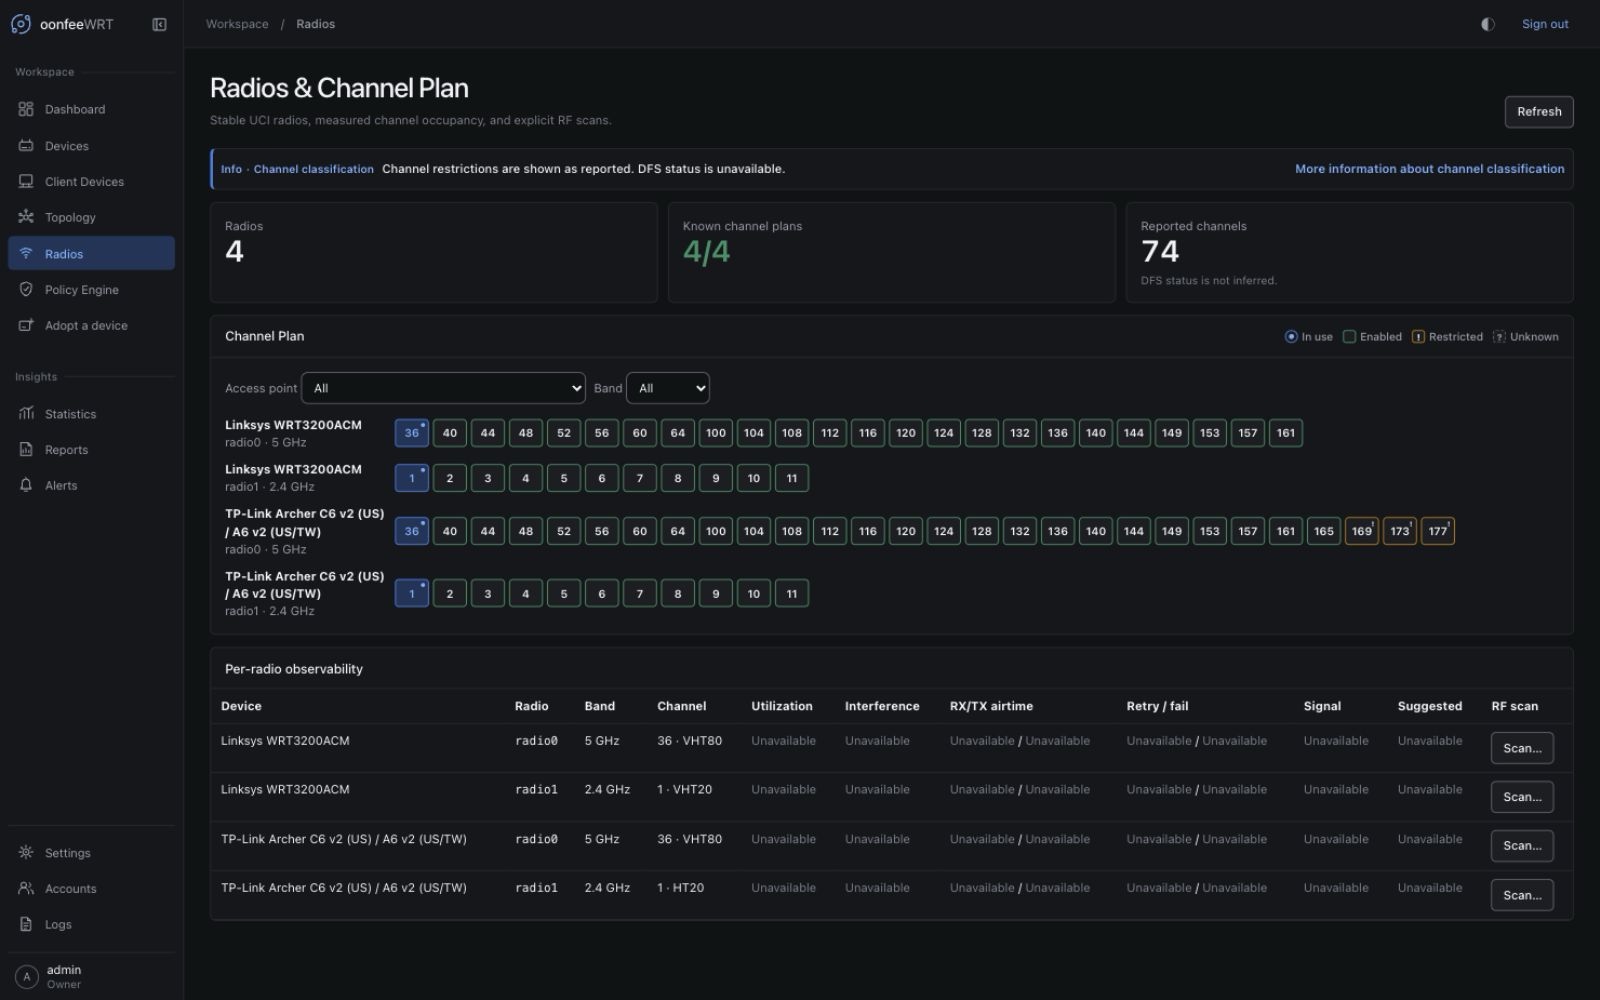
Continue with clients and topology or radios and channel planning.
Review configuration before changing routers
Use Settings → Network for site configuration and Policy Engine for zones, rules, and reusable objects. Editing controller intent, previewing it, and applying it are separate steps. A screenshot of an editor is not evidence that its contents have been applied to a router.
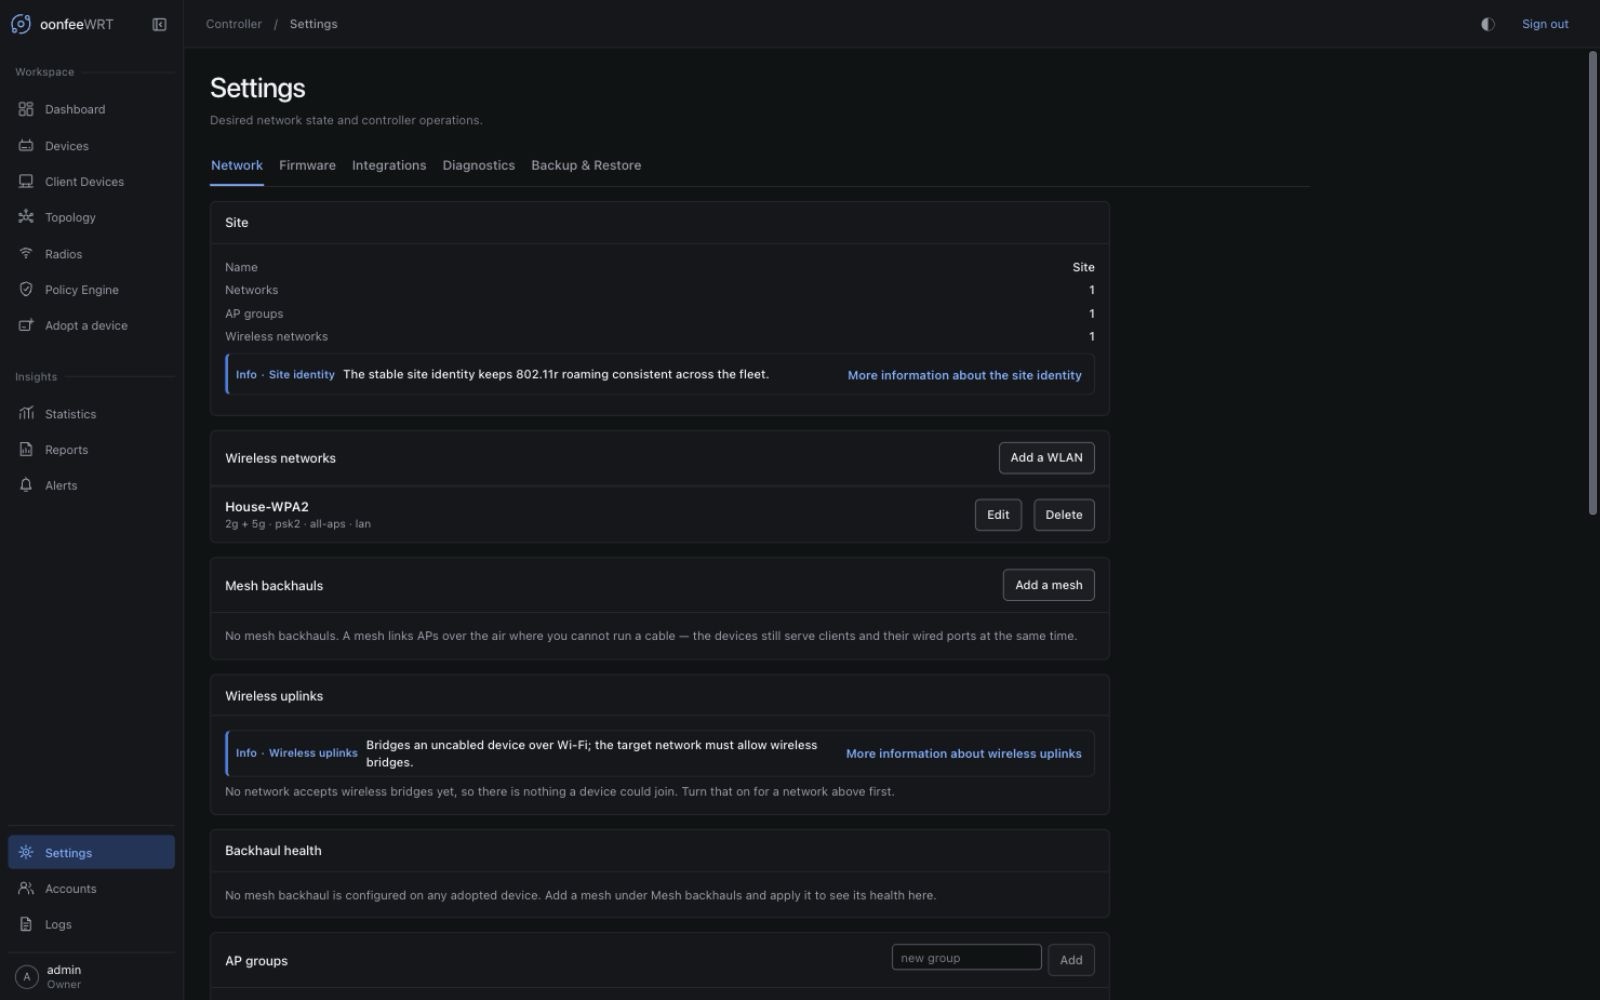
The network, Wi-Fi, and policy guides illustrate the individual sections. For a new device, start with the adoption walkthrough.
Manage access and recovery separately
Accounts → My account holds your password and sessions. The compact profile below Logs opens the same Accounts workspace; it is not an account switcher. Owners can use Manage accounts to administer other users. Diagnostics and backup/restore remain under Settings, while router events and controller audit history are in Logs.
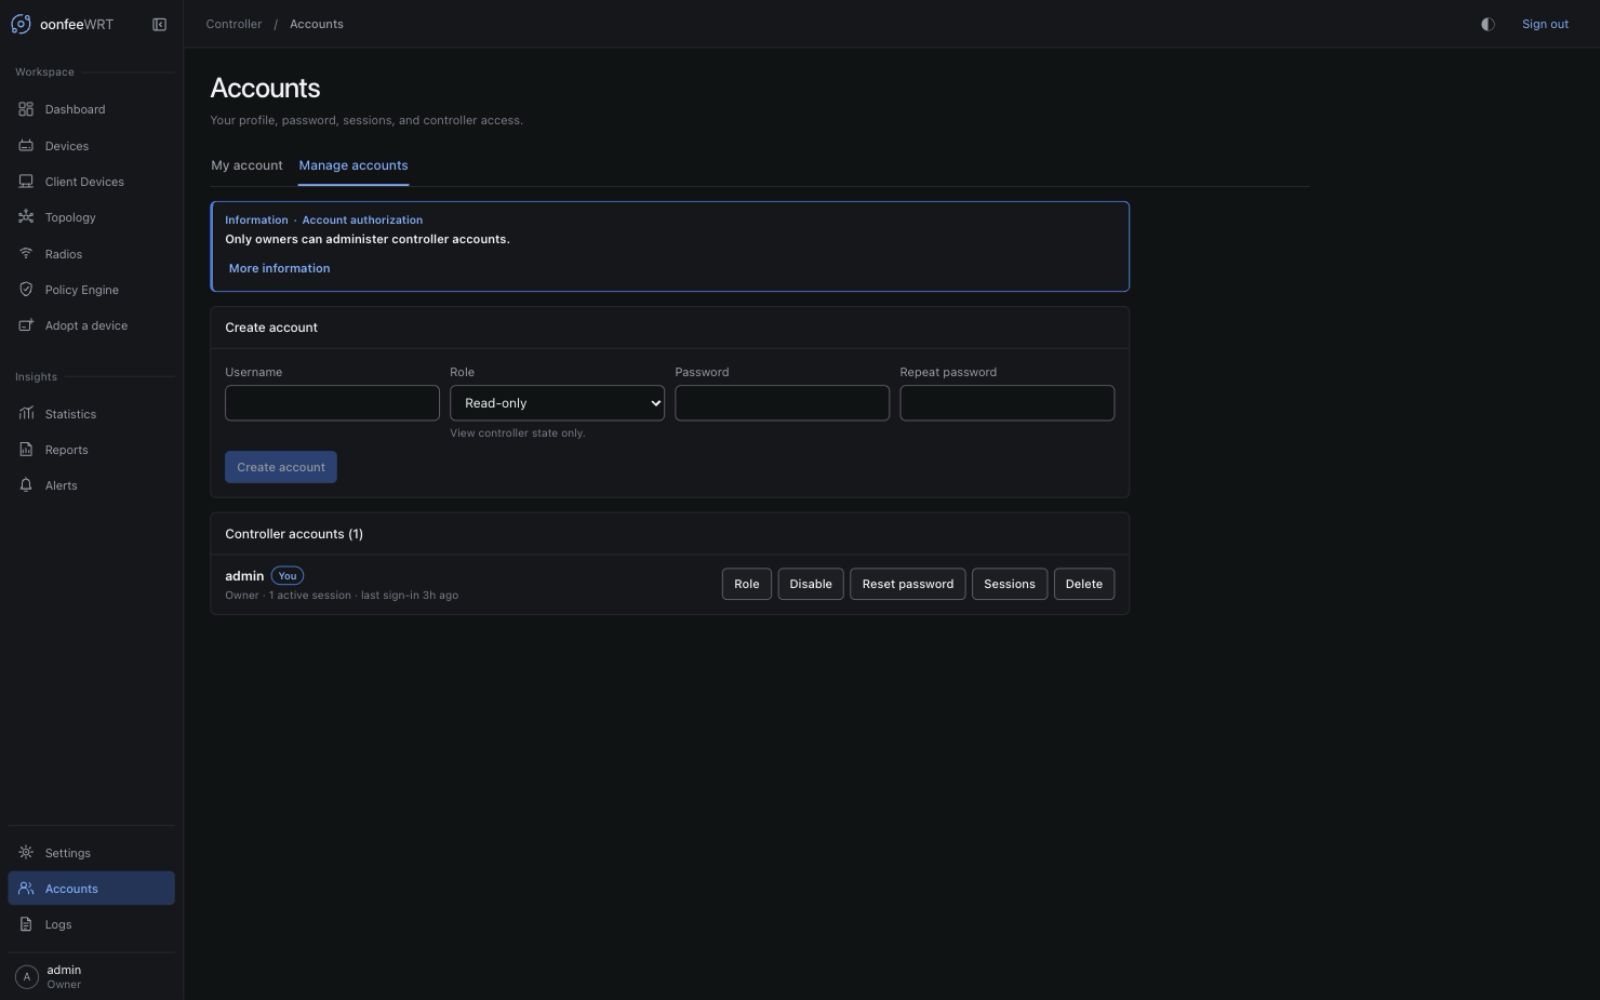
Use the illustrated account guide, logs and diagnostics guide, and backup/restore guide for the detailed procedures.