

Statistics and historical telemetry
Added in v0.1.6
Statistics was introduced in v0.1.6 and remains available in v0.1.8. The underlying rollup API and retention described here already exist in v0.1.5; this workspace is the presentation layer for those observations.
The Statistics workspace turns oonfeeWRT's stored metric rollups into a longer-range operational view. Use it to correlate WAN behavior with one device's load, memory, interface traffic, and available radio measurements over the same period.
The page is intentionally evidence-first. It shows only series and dimensions that the controller has actually catalogued, leaves unobserved buckets blank, and names partial coverage. It does not estimate missing values or invent a whole-network total.
Before you begin
- Sign in with any role, including Read only.
- Adopt at least one device and allow a complete five-minute telemetry window to finish. An incomplete in-memory window is not yet durable history.
- Assign the managed Gateway function and keep current route evidence available if you want the Internet section to identify WAN traffic.
- Treat an empty chart as missing history, not a measured zero.
Open Insights → Statistics in the sidebar. The direct route remains /statistics. The default range is 6h, so recent collection is easier to read without compressing it into a full day. The available ranges are 6h, 24h, 7d, and 30d.
What the controls change
| Control | Effect | What it does not do |
|---|---|---|
| Time range | Re-queries every visible series for one common window | It does not request a particular storage resolution; the server chooses the valid resolution |
| Device detail | Loads the selected device's stored series catalog and history | It does not change which device is the managed Gateway |
| Interface | Shows RX/TX rate history for exactly one catalogued interface key | It does not merge interfaces or infer which names are equivalent |
| Stable radio | Shows the available history for one stable UCI radio key, such as radio0 | It does not select a runtime PHY by guesswork or initiate a scan |
| Refresh | Re-reads the Dashboard gateway evidence, device inventory, series catalog, and visible rollups | It does not force a router poll or increase collection frequency |
The page also refreshes its data periodically while open. Viewing it does not put a device into the focused polling tier, so a Statistics tab cannot silently increase management traffic. The newest-bucket time tells you when the stored evidence was last populated; it is not the browser refresh time.
Read the Internet history
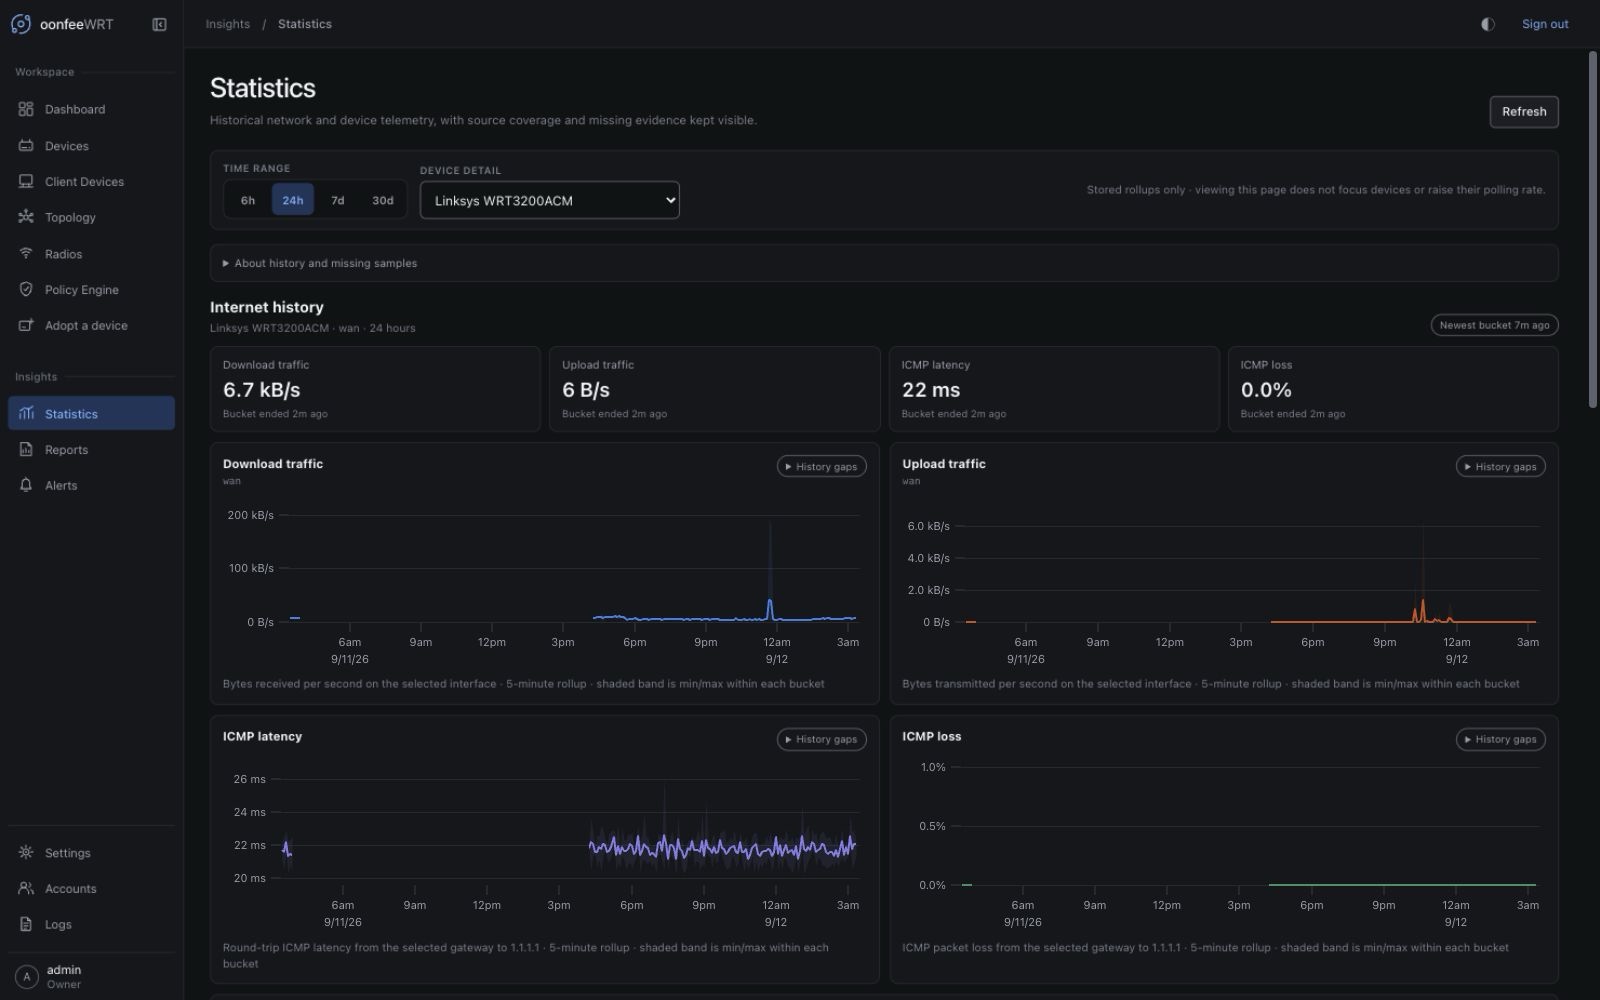
The Internet section combines four related—but distinct—kinds of evidence:
| Display | Stored series | Meaning |
|---|---|---|
| Download traffic | iface_rx_bps | Average bytes received per second on the proved runtime route interface |
| Upload traffic | iface_tx_bps | Average bytes transmitted per second on that same interface |
| ICMP latency | site_wan_latency_ms | Round-trip latency from the managed Gateway to the fixed probe target |
| ICMP loss | site_wan_loss_pct | Probe loss observed from the managed Gateway |
| ICMP reachability strip | site_wan_up | Whether all, some, or none of the stored probes in each bucket received replies |
Traffic is shown only when Dashboard has selected one usable, lowest-metric IPv4 default route in the main routing table, mapped it to one active OpenWrt logical interface, and found the exact runtime interface key in stored RX/TX history. A PPPoE route may therefore use pppoe-wan; oonfeeWRT does not fall back to wan, the first Ethernet interface, or a similarly named series.
If that exact key is unavailable, the traffic charts remain unavailable while ICMP history can still appear. If the controller cannot currently prove a managed Gateway and route, the Internet section stays unavailable instead of reusing an old path as current truth.
Interpret the ICMP charts narrowly
The managed Gateway sends three probes to 1.1.1.1 no more than once per minute. The rollups can show when that target replied, the measured round-trip time, and loss over the bucket. They do not prove:
- DNS resolution worked;
- an HTTP or HTTPS service worked;
- every destination was reachable;
- the ISP met an uptime commitment; or
- another policy-routed or
mwan3path had the same result.
The reachability strip separates All probes replied, Mixed replies, No probe replies, and Missing buckets. A mixed bucket contains both positive and negative probe observations; it is not rounded into a simple up/down claim. Blank space means no valid stored observation. It is not downtime and is not silently counted as a successful probe.
Traffic rate is not traffic accounting
iface_rx_bps and iface_tx_bps are counter-derived bytes-per-second rates. The collector handles counter reset and wrap behavior before storing the rate. The Statistics page does not calculate transferred-byte totals, billing usage, per-application usage, or per-client Internet consumption from those averages.
The WAN direction is from the selected interface's point of view. On an ordinary Internet uplink, receive normally corresponds to download and transmit to upload, but unusual routing, tunnelling, or interface layouts can change how that should be interpreted.
For an equal-length period comparison and an exportable summary, use Reports. Reports uses valid completed rollups and explicit coverage too; it is not a billing counter or SLA certificate. For sustained conditions, use Alerts, whose hold windows require continuous fresh evidence rather than visual interpolation across chart gaps.
Read device history
Choose an adopted managed or monitor-only device in Device detail. The controller first asks for that device's series catalog, then requests only the series keys proven to exist.
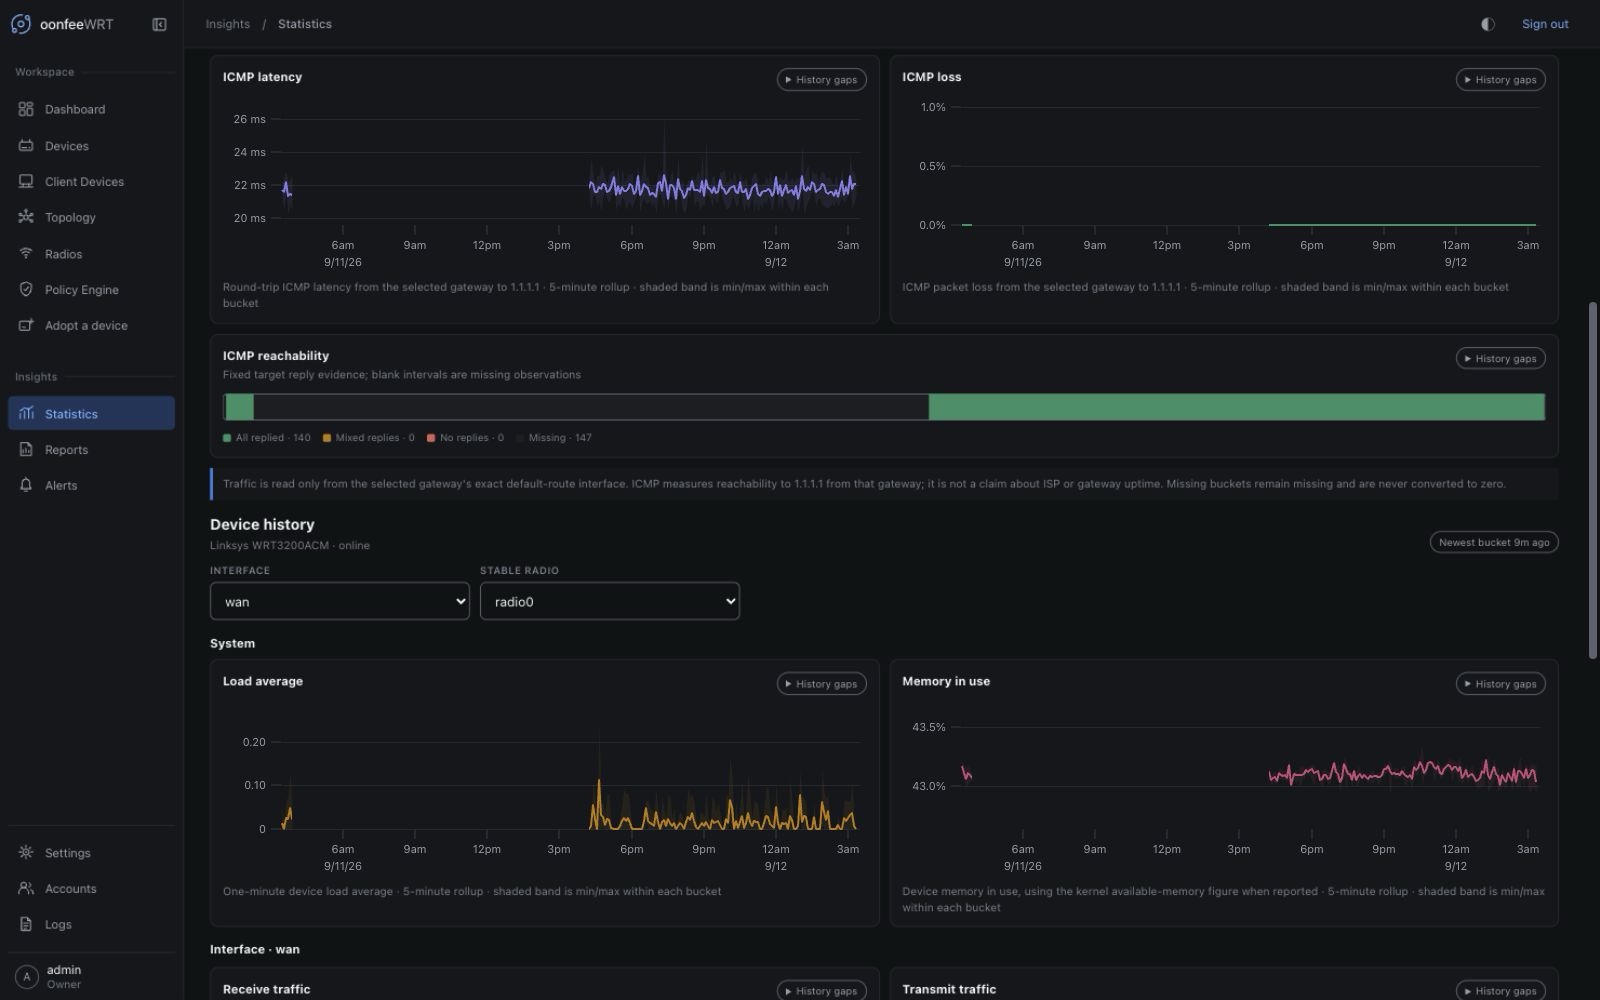
System
- Load average is the device's one-minute load average stored in each rollup.
- Memory in use is shown as a percentage when that derived series exists. If only the byte series is available, the page displays used bytes instead. The collector prefers the kernel's available-memory figure when the router reports it.
Load average is not CPU percentage. Compare it with the device's CPU count, current work, collection gaps, and interface activity before treating a high number as overload.
Interface
The selector contains the exact interface keys present in stored RX or TX series for that device. The two charts show receive and transmit bytes per second for the selected key. They are not summed across a bridge, its member ports, tunnels, or similarly named interfaces.
Use the selected interface name as provenance. If an expected interface does not appear, confirm that the router exposes its counters, wait for a completed rollup, and review the device's capability and collection gaps. Do not rename an interface merely to make a chart appear.
Radio
Radio series use stable UCI wireless-device keys such as radio0, not runtime PHY or WLAN interface names. Depending on the hardware, driver, current stations, and stored source coverage, the page can show:
| Metric | Interpretation |
|---|---|
| Radio utilization | Proportion of observed active time reported busy |
| Radio interference | Busy time not attributed to the radio's own RX/TX evidence, when trustworthy inputs exist |
| Receive / transmit airtime | Available RX and TX portions of observed airtime |
| Radio retries | Counter-delta retry ratio for an observation interval |
| Radio transmit failures | Counter-delta failure ratio for an observation interval |
| Average client signal | Mean signal of measured stations associated with that stable radio |
These are capability-dependent. Missing counters, unstable driver values, no measured stations, a reset, or a collection gap can legitimately leave one metric absent while another remains available. Radio and station detail can be collected only in focused contexts on some paths; because Statistics does not raise the polling tier, its radio history may be sparse or absent until such evidence has already been collected.
The page does not show a spectrum waterfall, infer interference from an empty source, or run an RF scan. Use Radios and channel planning for current radio inventory, channel evidence, and the separately acknowledged scan workflow.
Understand a chart
Each metric card preserves the storage contract rather than smoothing it into a more confident picture:
- The line is the average of valid samples in each stored bucket. Connected samples use a clean line; a small dot preserves an isolated observation that could not otherwise form a line. Hover highlights the nearby sample.
- The subtle shaded band is that bucket's measured minimum-to-maximum range; no smoothing removes its peaks.
- The x-axis covers the complete requested window, even if history exists for only part of it.
- Missing buckets break the line. The chart never interpolates across them.
- The neutral Full history, History gaps, or No history control opens the exact observed and expected interval counts. These describe stored evidence, not router health. Failed refreshes still appear separately.
- The expected count includes only complete, aligned storage buckets inside the requested window; an in-progress bucket at either edge is not a gap.
- The summary card uses the newest valid stored bucket, not a live RPC value.
- Invalid, non-finite, out-of-range, duplicate, or out-of-window points are excluded and disclosed rather than drawn.
The chart itself has an accessible text summary containing the observed range, latest average, and timestamps. The page's controls, coverage states, and empty/error notices remain available in both light and dark themes and at mobile widths.
Resolution and retention
The server chooses one stored resolution for the requested range:
| Request | Expected resolution | Retention boundary |
|---|---|---|
| 6 hours, 24 hours, or 7 days | Five-minute rollups | Five-minute data is retained for 14 days |
| 30 days | Hourly rollups | Hourly data is retained for 396 days |
A request spanning more than seven days, or beginning more than 14 days ago, uses hourly rollups. The page labels the returned resolution; the browser does not fabricate higher-detail points. See Data and retention for shutdown, pruning, and backup behavior.
The stored timestamp identifies the start of a bucket. A five-minute or hourly bucket may contain several source samples; its cnt is not a percentage and does not turn an incomplete time window into complete coverage.
Why gaps happen
Common causes include:
- the device was adopted recently;
- the current five-minute window has not completed;
- the controller restarted before an incomplete in-memory bucket was flushed;
- the router, transport, or individual source was unavailable;
- a counter reset or reboot prevented a valid counter delta;
- the hardware or driver does not expose the metric;
- a radio had no measurable associated stations; or
- the requested period is older than the retained resolution.
Use the source-specific gaps on Devices, Radios, and Logs to decide which explanation applies. Do not fill a gap with zero when comparing charts.
For example, 17 samples out of 287 expected five-minute intervals can mean the controller has only recently resumed collection within a 24-hour view. It does not establish that the network was down for the other 270 intervals. Keep the controller running as a persistent service and maintain its route to the devices to build future history. A completed window can appear after the next storage flush; Refresh does not force a new router poll or recreate old data. Choose 6h for a closer view, or retain 24h when the missing time itself is relevant. About history and missing samples keeps this guidance available above the charts.
If one series request fails while others succeed, Statistics keeps the successful series current. A failed card labels the refresh error and can keep its last successful response visible only for the same device, metric, and exact series key. Changing the source clears incompatible retained history immediately, even if the replacement request fails. Check each card's error and timestamps before comparing it with another card.
Practical investigations
A latency or loss incident
- Select 24h or 7d and locate the affected ICMP buckets.
- Check the reachability strip to distinguish all-reply, mixed-reply, no-reply, and missing buckets.
- Compare upload and download rate on the exact WAN interface.
- Compare the Gateway's load and memory in Device history.
- Open Logs for transport, router, or controller warnings around the same time.
- Use an independent DNS or application test before concluding that the ISP was down.
A device-performance question
- Select the device and one exact interface.
- Compare its load and memory with RX/TX rate over a shared range.
- Check whether all cards have comparable coverage and newest-bucket times.
- Open Devices for current health, capabilities, and management overhead.
A Wi-Fi-quality question
- Select the AP and stable radio.
- Compare utilization, interference, airtime, retries, failures, and signal only where those series exist.
- Treat missing station signal separately from a low measured signal.
- Open Radios for current channel-plan evidence or a deliberate RF scan; open Client Devices for one client's time-aligned observability view.
Current boundaries
Statistics is an operational rollup browser, not a flow-analysis or business intelligence system. It currently does not provide:
- application or DPI identification;
- per-client or per-application Internet usage totals;
- packet captures or payload inspection;
- multi-WAN,
mwan3, policy-route, or failover-path history; - combined fleet totals or cross-device arithmetic;
- controller-management-overhead history;
- speed-test history beyond the bounded records on Dashboard;
- automatic anomaly scoring, forecasting, or an invented health score; or
- CSV/report export from the Statistics page.
For the evaluated limits of future application/flow visibility, read the flow visibility feasibility review.
Troubleshooting
| Symptom | Likely explanation | What to do |
|---|---|---|
| Internet section says no managed Gateway is available | The site has no managed Gateway or its route evidence is missing, stale, failed, or ambiguous | Open Dashboard and the Gateway device; restore current main-table route and netifd evidence |
| ICMP appears but WAN traffic does not | The proved kernel route interface has no exact RX/TX series key | Review the route interface and device series; do not substitute another interface by name |
| Interface or radio selector is empty | No retained series key is catalogued for that dimension | Wait for a completed rollup, then check capability/source gaps and whether that metric is collected on the baseline or focused tier |
| A line stops and resumes | Buckets are missing between valid observations | Correlate Logs and device status; do not interpret the gap as zero or interpolate it |
| 30-day charts look less detailed | The server correctly selected hourly history | Narrow the range for five-minute detail where it is still retained |
| Load looks high but traffic is low | Load average is not CPU percentage and can reflect other work or blocked tasks | Compare device CPU count and current processes through normal OpenWrt diagnostics |
| Cards show different newest times | Sources were collected or refreshed at different times, or one request failed | Read each card's coverage/error state before correlating values |