

Dashboard and Internet health
The Dashboard answers three questions quickly: is the controller receiving fresh evidence, can the managed Gateway reach the Internet, and where should I investigate next? It combines fleet counts, WAN observations, topology, speed-test history, and recent warnings without hiding missing sources.
History and alerts in Insights
The workspaces introduced in v0.1.6 remain available under Insights in the v0.1.8 sidebar: Statistics for detailed history, Reports for adjacent-period comparisons/CSV, and Alerts for configured sustained conditions. These are separate from the Dashboard's current observations and recent warning summary. A report is not a traffic bill, and a missing alert sample is not a healthy result.
Before you begin
- Sign in with any controller role, including Read only.
- Adopt at least one device to populate fleet health.
- Assign the Gateway function to the device that carries the default route if you want Internet health. oonfeeWRT supports one managed Gateway.
- Allow time for the first collection cycle. An empty value before collection is different from an observed zero.
Read the fleet overview
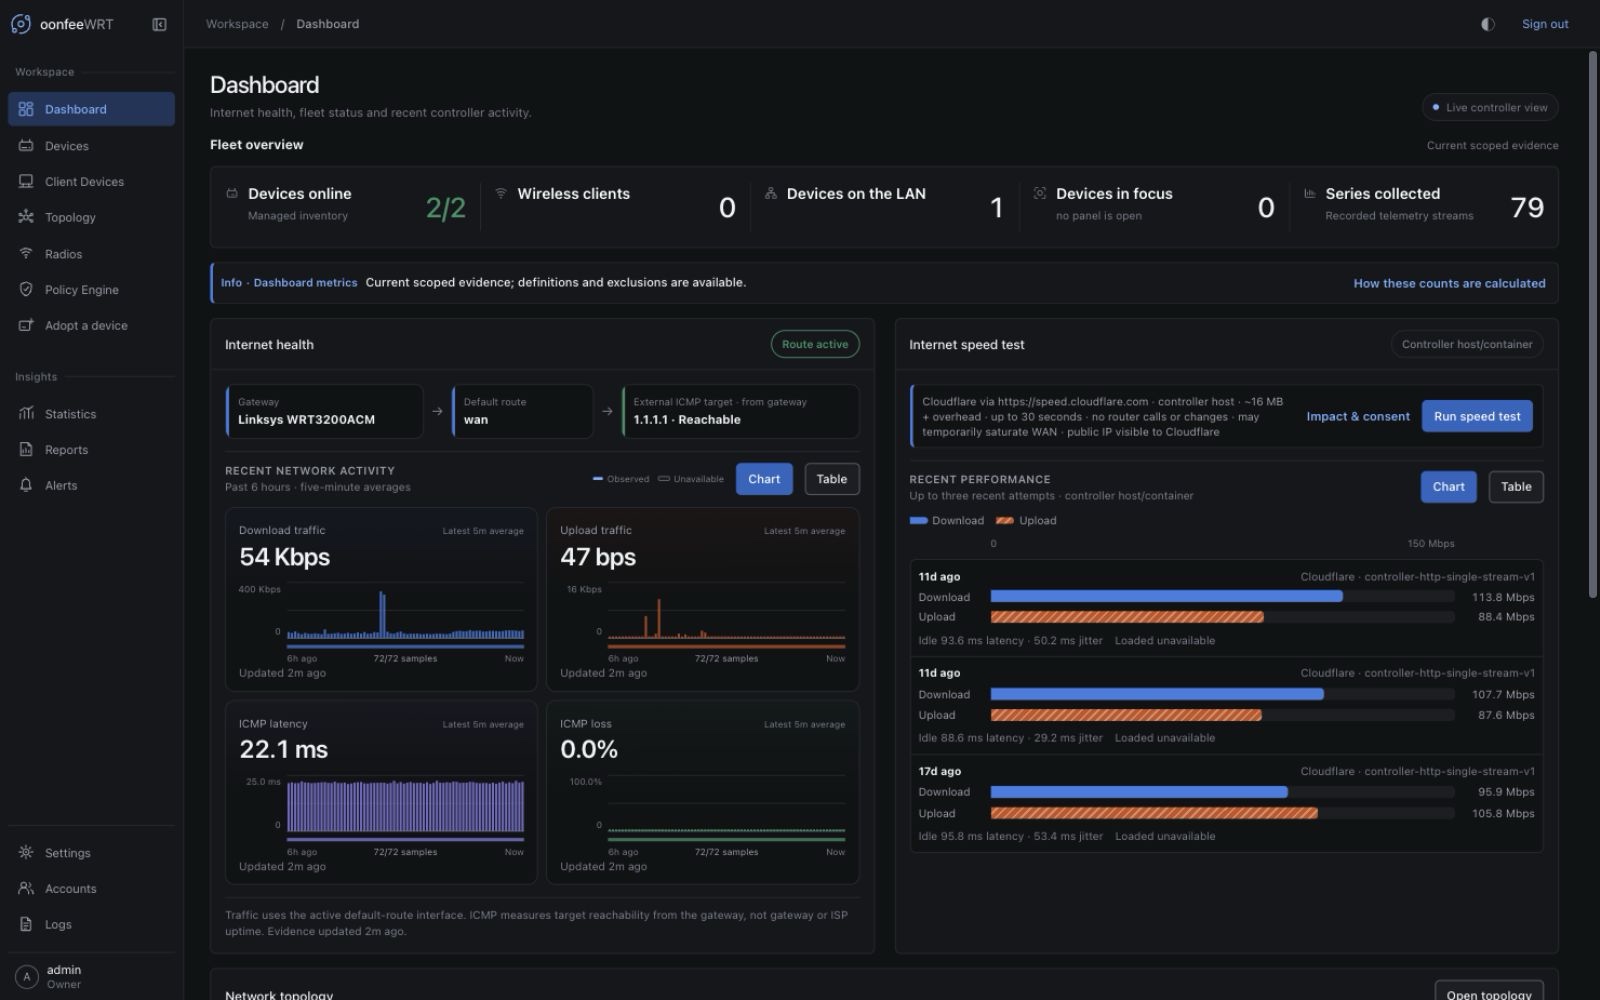
Open Workspace → Dashboard. The shared fleet strip summarizes the whole current fleet, with labels and scope notes on the left and counts on the right. Its five metrics retain the same meaning as the v0.1.6 overview cards:
| Card | Meaning | Investigate when |
|---|---|---|
| Devices online | Devices with sufficiently recent successful management evidence | The online count falls or a device alternates between states |
| Wireless clients | Fresh stations attributed to devices with the AP function | The value is marked incomplete or differs from an AP's local view |
| Devices on the LAN | Client inventory scoped to managed LANs | Infrastructure appears as a client or a neighbour is incorrectly scoped |
| Devices in focus | Devices temporarily using the fast collection tier because a live detail view is open | The count stays high after viewers leave detail screens |
| Series collected | Durable metric series currently known to the controller | Charts remain empty after several collection intervals |
Counts carry source-coverage information. A partial wireless-client count is not silently presented as a complete fleet total. Follow the adjacent source message before treating a number as authoritative.
The strip uses one surface with subtle dividers instead of five separate card outlines. Labels stay aligned when some metrics need helper text and others do not. At smaller widths the strip becomes two columns, then a single column; decorative icons can disappear to make room, but values and evidence explanations remain. A large count or long source note can expand a cell—text is not clipped to preserve a fixed height.
Understand Internet health
Internet health is derived from the managed Gateway, not from the browser and not from a cloud service.
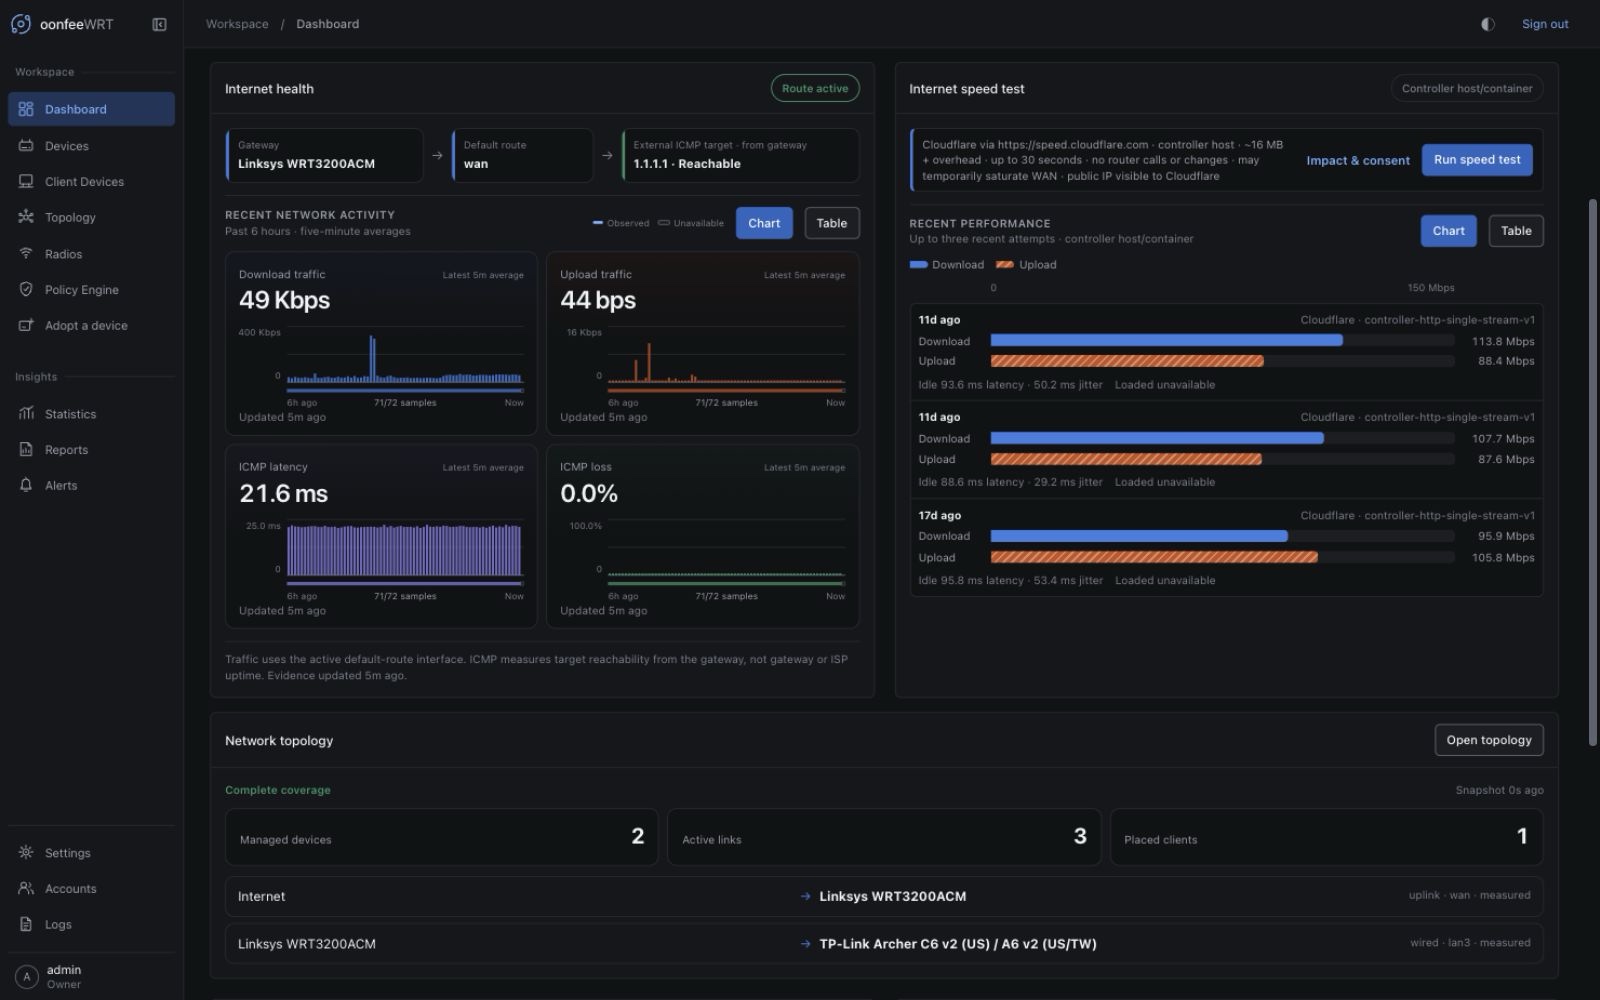
Observed Gateway path
The selector introduced in v0.1.3 identifies one effective IPv4 uplink from the installed kernel routing table. It selects the unique usable, lowest-metric default in the main table, then maps that kernel device to exactly one active OpenWrt logical interface that also reports a default-route candidate. This prevents a modem-management interface from winning merely because netifd listed it first and maps logical wan to the runtime pppoe-wan device when appropriate.
The route table and network.interface dump form one observation. If either read fails, the route is malformed, equal lowest metrics point to different devices, a multipath route is present, or the kernel device cannot be mapped uniquely, the current path is unavailable. The controller preserves its last proved network cache but does not turn that cache into a new route claim or guess a counter series.
This scope is deliberately narrow: custom policy routing, mwan3, per-uplink health, manual WAN selection, and bond-member monitoring are not modeled. A policy-selected path can differ from the observed main-table route. Route evidence runs on the approximately 15-minute network/topology cycle, so use a dedicated failover monitor when sub-minute detection matters.
ICMP reachability
The Gateway sends exactly three ICMP probes to 1.1.1.1, no more than once per minute. The displayed latency and loss establish only that this target was reachable over ICMP at that time.
They do not prove:
- DNS works;
- HTTP or HTTPS works;
- every Internet destination is reachable;
- the ISP has met an uptime target;
- the router itself has available bandwidth.
ICMP may also be deprioritized by a network. Correlate loss with traffic, events, device state, and an independent application test.
Six-hour trends
The chart and accessible table show five-minute rollups for:
- download traffic;
- upload traffic;
- ICMP latency;
- ICMP loss.
Coverage markers distinguish observed buckets from unavailable ones. A gap is not a zero. Use the table when you need exact timestamps and values; use the chart to correlate simultaneous changes.
Open Insights → Statistics when you need the same proved WAN source over 24h, 7d, or 30d, want explicit bucket-coverage counts, or need to compare it with the Gateway's system, interface, and available stable-radio history. See Statistics and historical telemetry.
Run a controller speed test
The speed test measures the path from the controller host or container to Cloudflare. It is useful when that host shares the WAN path you care about, but it is not a router-native test.
Read-only accounts can inspect the plan and history. Starting or cancelling a test requires the Operator, Admin, or Owner role.
Bandwidth and privacy impact
One completed attempt transfers approximately 15 MiB—10 MiB down and 5 MiB up—is bounded to 30 seconds, and can temporarily saturate a slower WAN. The controller's public IP and test requests are visible to Cloudflare.
- Open Workspace → Dashboard.
- Open the impact and consent details and review the exact endpoint, limits, controller-host vantage point, and data-use disclosure.
- Select Run speed test. This action is the explicit, plan-bound acknowledgement and starts the test immediately.
- Leave the Dashboard open to watch progress.
The result can include download, upload, idle latency, and idle jitter. Loaded latency and loaded jitter are not measured in v0.1.8. The controller retains the newest three terminal attempts, including failed or cancelled attempts, so a failure does not disappear from history.
Verify the result
- Confirm the result says Completed and has a finish time.
- Compare the chart bar with the exact result table.
- Check whether the controller host uses the same uplink, VPN, container network, or traffic policy as the device path you intended to evaluate.
- Compare against live traffic. A speed test run while the network is busy is evidence of the combined load, not an unloaded line rate.
Cancel or recover
Use Cancel while a test is running. The terminal history should report the cancelled outcome. If the UI disconnects, reopen the Dashboard; the controller owns the job and exposes its current or terminal state after reconnecting.
Use topology and event summaries
The Dashboard includes a compact topology view and recent warning/error list.
- Open Topology for confidence, medium, VLAN, history, and full source-gap controls.
- Open Logs when a warning needs its complete details or surrounding audit events.
- Open the named Device when the event points to capability, collection, or management overhead.
A practical investigation sequence
When the Dashboard looks unhealthy:
- Confirm whether the data is fresh, stale, partial, or unavailable.
- Compare the affected device's online state and last-seen time.
- Check the Gateway path and WAN source message.
- Correlate traffic, latency, and loss across the same time range.
- Review recent warnings and errors.
- Open Topology for a path or placement change.
- Run a speed test only if its controller-host vantage and bandwidth impact answer the remaining question.
Troubleshooting
| Symptom | Likely explanation | What to do |
|---|---|---|
| Internet health is unavailable | No managed Gateway, stale/incomplete kernel-route and interface evidence, failed poll, or unsupported route shape | Open the Gateway device and review the default-route source gap. Correct the route or transport/permission problem, then allow the next network/topology cycle; refresh the ACL only when the UI names a missing permission |
| Wireless count is incomplete | One or more AP-function devices lack fresh station evidence | Open Devices, find the named coverage gaps, and wait for or troubleshoot their focused poll |
| Charts show gaps | The bucket had no valid samples; the controller restarted, device was unreachable, or a source failed | Use the accessible table and Logs; do not interpret the gap as zero |
| Speed test is much slower than expected | Container/VPN path, concurrent traffic, controller-host limits, or shared WAN saturation | Verify the host path and repeat during a controlled quiet window only if another 15 MiB test is acceptable |
| Speed test fails immediately | Controller cannot reach the Cloudflare endpoints or the job was refused by current state | Check controller logs, DNS/HTTPS egress, and whether another test is active |
| A device is online but WAN health is missing | Device management reachability and Gateway Internet evidence are separate | Verify the Gateway function, default route source, and probe result on that device |
| PPPoE WAN traffic is unavailable | The kernel L3 route device has no matching counter series, cannot map to exactly one active logical interface, or the composite source failed | Compare the main-table route with OpenWrt interface state, correct the inconsistency, and wait for the next network/topology cycle; do not rename interfaces as a workaround |
| Main-table route is healthy but a policy-routed path differs | v0.1.8 does not model policy routing, mwan3, per-uplink health, or manual WAN selection | Treat the Dashboard path as main-table evidence only and use the policy/failover system's own status for that traffic |