

Reports and period comparisons
Added in v0.1.6
Reports was introduced in v0.1.6. The screenshot was captured on 12 September 2026 from the v0.1.7 release-candidate UI source before tagging, using retained data from a development network.
Reports turns retained WAN observations into a readable review. Use it to compare recent conditions, share a CSV summary, and see whether enough evidence exists to support a conclusion. Use Statistics for detailed time-series exploration.
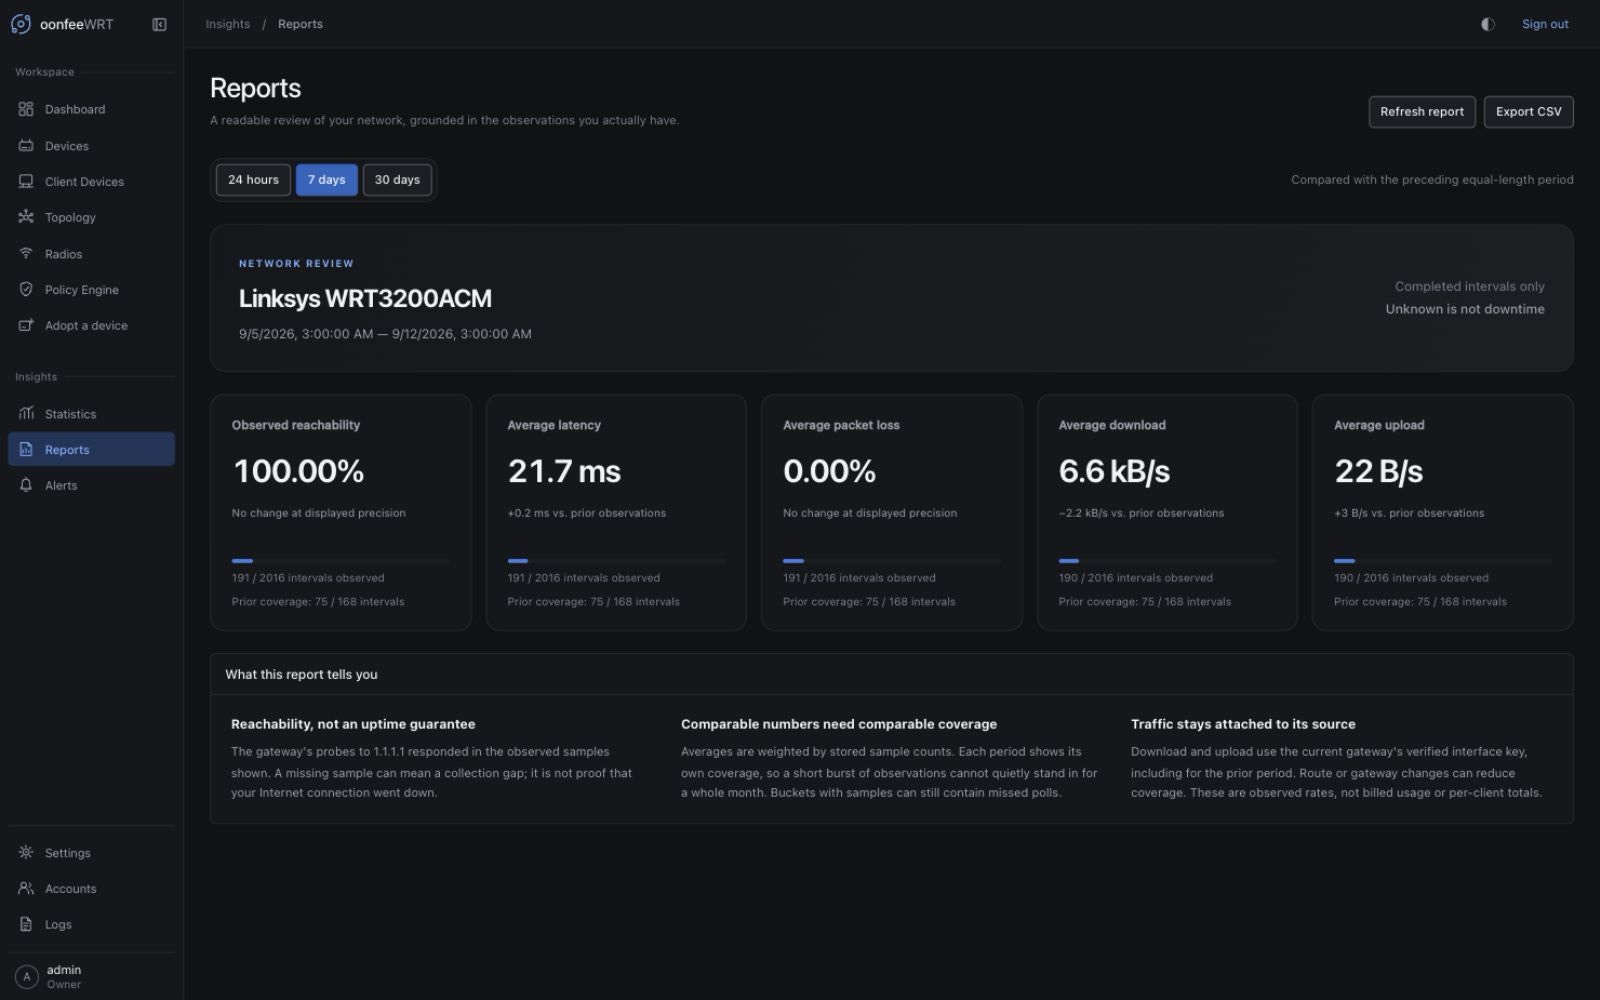
Generate a report
- Open Insights → Reports from the sidebar, or use
/reports. Any signed-in role can read it. - Select 24 hours, 7 days, or 30 days. Seven days is the default.
- Confirm the gateway name and displayed start/end times.
- Read each value together with its observed-interval count and the previous period's coverage.
- Use Refresh report for a new snapshot or Export CSV to download the values and coverage shown.
The end time is rounded down to a completed hour. Both periods have the same length and aligned boundaries. The previous period ends exactly where the selected period starts. The page does not silently keep old-period values under a new period selector while a request loads. In v0.1.7, a period change or refresh immediately invalidates the previous result for display and export. Wait for the requested report to finish before exporting; the CSV's UTC dates come from that completed report, not from an older selection. A late response from an earlier request cannot replace the current report.
Understand the five summaries
| Summary | Meaning | Does not prove |
|---|---|---|
| Observed reachability | Sample-weighted average of the gateway's recorded ICMP reachability samples | Continuous ISP, gateway, or Internet uptime |
| Average latency | Sample-weighted round-trip latency to the displayed probe target | Application response time or latency to every Internet destination |
| Average packet loss | Sample-weighted recorded ICMP loss percentage | The cause of packet loss or failure of all protocols |
| Average download | Observed receive rate on the gateway's verified WAN interface | Total billed usage or attribution to individual clients |
| Average upload | Observed transmit rate on that same interface | A speed test or an estimate of available link capacity |
Percent changes in reachability and packet loss use percentage points (pp). A move from 1% to 2% loss is +1 percentage point. Other differences use their original units. A change is not marked inherently good or bad: higher traffic may be expected, and different data coverage can alter a comparison.
Coverage is part of the result
Each card shows observed / expected completed intervals. For example, 20 / 2016 intervals observed means only 20 five-minute buckets in a seven-day window contain usable observations. It does not mean the network was down for the other intervals.
- Missing, incomplete, unaligned, or invalid buckets do not become zeros.
- A bucket with samples can still contain missed polls. Bucket coverage is not proof of uninterrupted sampling.
- Averages are weighted by the number of samples in each stored bucket, not by treating every five-minute or hourly mean as equally sampled.
- Prior and selected periods may use different retained resolutions. Both retain their own denominator and sample counts.
- No current evidence is shown as
—, not 0% or 100%. - If a series request fails, its error appears on the affected card. Other successfully loaded series remain available.
Gateway and interface changes
Both periods use the currently selected gateway and its currently proved interface series key. The report does not combine old gateways or guess that two differently named interfaces are the same WAN. A gateway or route change can therefore produce a gap in the prior period. If an interface key cannot be proved, throughput is unavailable even when ICMP history exists.
Export and sharing
CSV contains metric names, units, gateway name, UTC window boundaries, sample-weighted averages, sample counts, and coverage for both periods. It does not export router credentials or client MAC lists. Gateway names may still identify your environment, so review the file before sharing it publicly.
Blank CSV values mean unavailable. They must not be imported as zero when building a spreadsheet or downstream dashboard. Export is disabled when no usable metric is present or the requested period/refresh has not finished.
If the report is empty
Check that a gateway is adopted and observed, then review Statistics and device details. A newly started controller needs completed collection buckets; waiting cannot recreate history from before collection began. Check controller connectivity and source permissions if existing history stops growing.