

Clients and topology
The Clients and Topology workspaces connect endpoint presence with the infrastructure path used to observe it. Both preserve evidence confidence and coverage gaps so an inferred link never looks like a measured cable.
Client and topology features retained in v0.1.8
v0.1.6 introduced a clearer client summary and illustrated topology nodes, plus a browser-local editable map. These are presentation changes: they do not add packet capture, virtual-machine discovery, new link evidence, or router configuration authority. Published v0.1.5 keeps its original map and inventory.
Client Devices
The Client Devices table is scoped to managed LANs and excludes adopted infrastructure from the client count without deleting it from inventory.
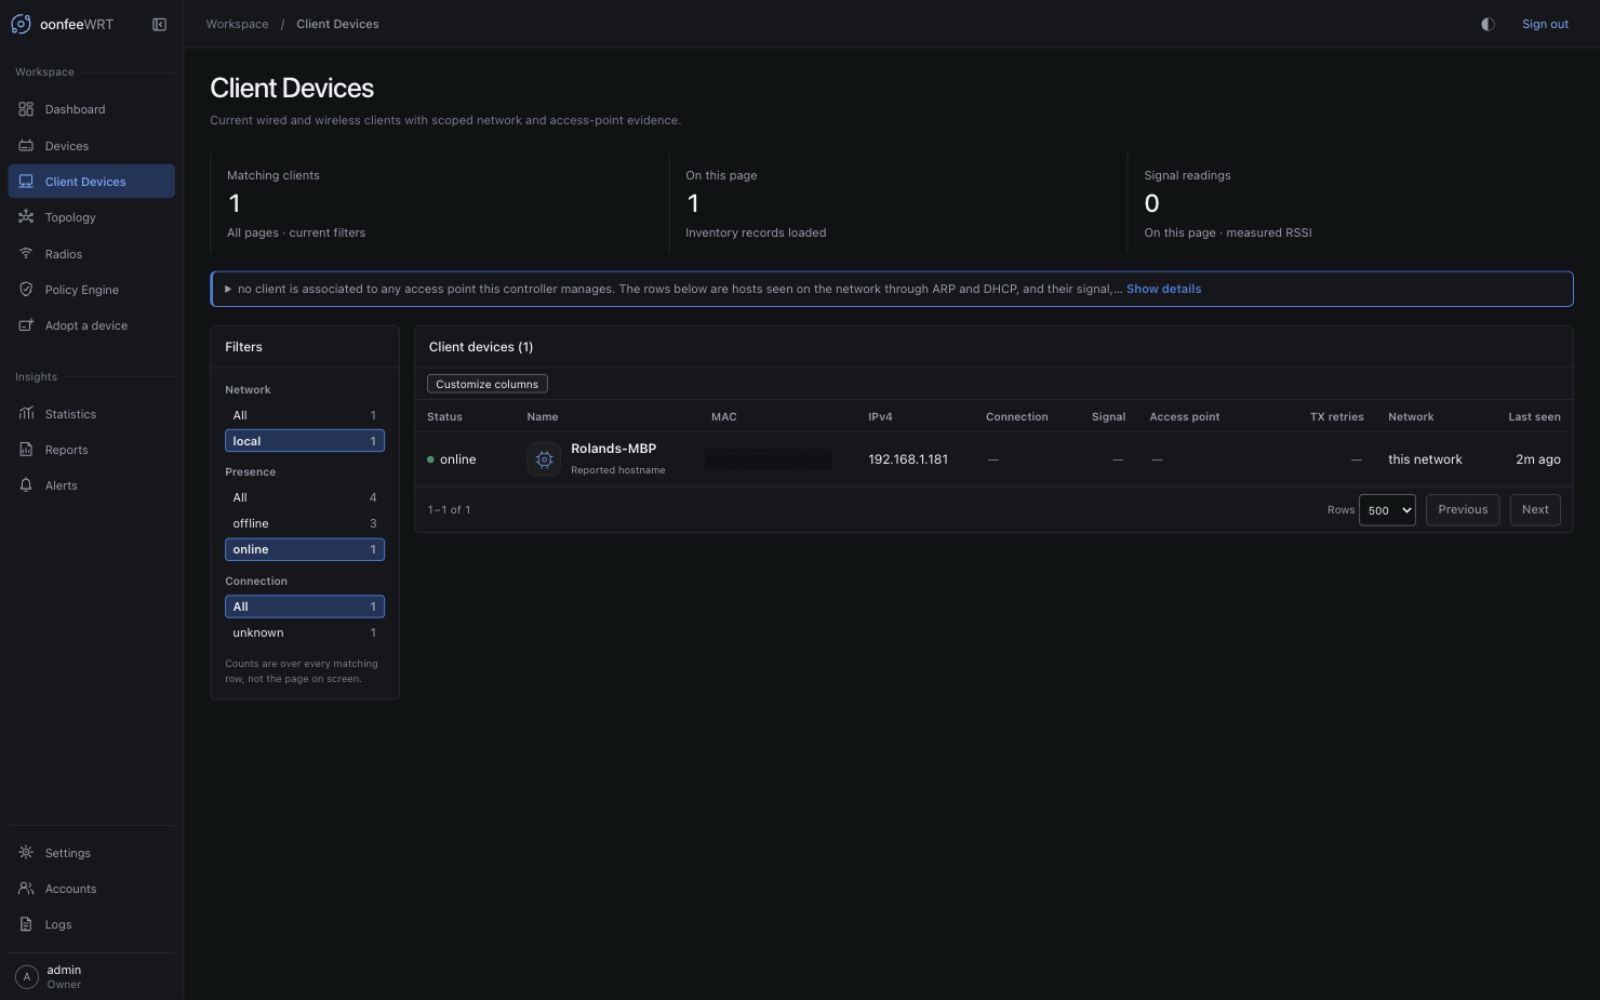
Use the filters
Filters operate on the complete matching result before pagination:
- network scope (This network, Upstream, Unknown, or all);
- presence (Online, Offline, or all);
- connection evidence (Wireless, Unknown, or all).
The current table does not claim that an endpoint is wired merely because no managed AP reports it, and v0.1.8 has no client text-search or source-coverage filter.
The count above the table is the filtered total, not merely the number of rows on the current page.
The inventory summary makes the scopes explicit: Matching clients spans all pages under the current filters, while On this page and Signal readings describe only the loaded page. Changing a filter resets pagination. A delayed response for a previous page or filter is not shown under the new selection. The client workspace remains a paginated table; the infrastructure Cards/List switch belongs to Devices, not Client Devices.
Client illustrations are generic identity aids. They do not prove that an endpoint is a laptop, phone, virtual machine, manufacturer, or operating system. Names and vendor hints are not authentication.
Read presence carefully
Presence is based on fresh fleet evidence, not on the fact that a MAC once appeared in inventory. A historical neighbour or stale station entry must not keep a client “online” after its live evidence expires.
Possible explanations for a missing or partial row include:
- the responsible device is offline or has not completed a poll;
- the client is outside the managed network scope;
- station or neighbour evidence is stale;
- AP attribution is incomplete;
- the client uses a randomized MAC and has a second inventory identity;
- the source is unavailable on this hardware/driver.
Scope is also a policy safety boundary
This network means the controller has evidence that a client is local to the managed Gateway. Upstream and Unknown clients can remain useful for inventory and topology. Its observations alone cannot authorize exact-MAC firewall sets, direct-MAC Secure rules, block intent, or fixed IPv4 intent.
Schema 23 preserves source-relative client observations by (device_id, MAC). MAC policy requires a stored local observation from the currently adopted Managed Gateway. A Monitor-only AP, Switch, or routed device neither satisfies nor contaminates that proof, including after it is un-adopted; its clients stay visible for observation. Portable restore deliberately clears source-relative observations, and authorization rejects stale or implausibly future-dated evidence. If the managed Gateway has not observed the client successfully— commonly just after an upgrade or portable restore—use a managed network/zone or explicit IPv4 scope, or wait for a successful Gateway poll.
Open Client Observability
Select a client row to open the joined investigation workspace. It keeps a shared time cursor across the evidence it can correlate, including:
- current identity and presence;
- network and AP/path attribution;
- client, AP, and site health context;
- an event spine around the selected time;
- wireless/traffic metrics and accessible tables when present;
- explicit source and freshness gaps.
Use the same time cursor when comparing a client symptom with AP load, radio quality, WAN health, and events. Correlation by time is more reliable than comparing each screen's latest value after the incident has passed.
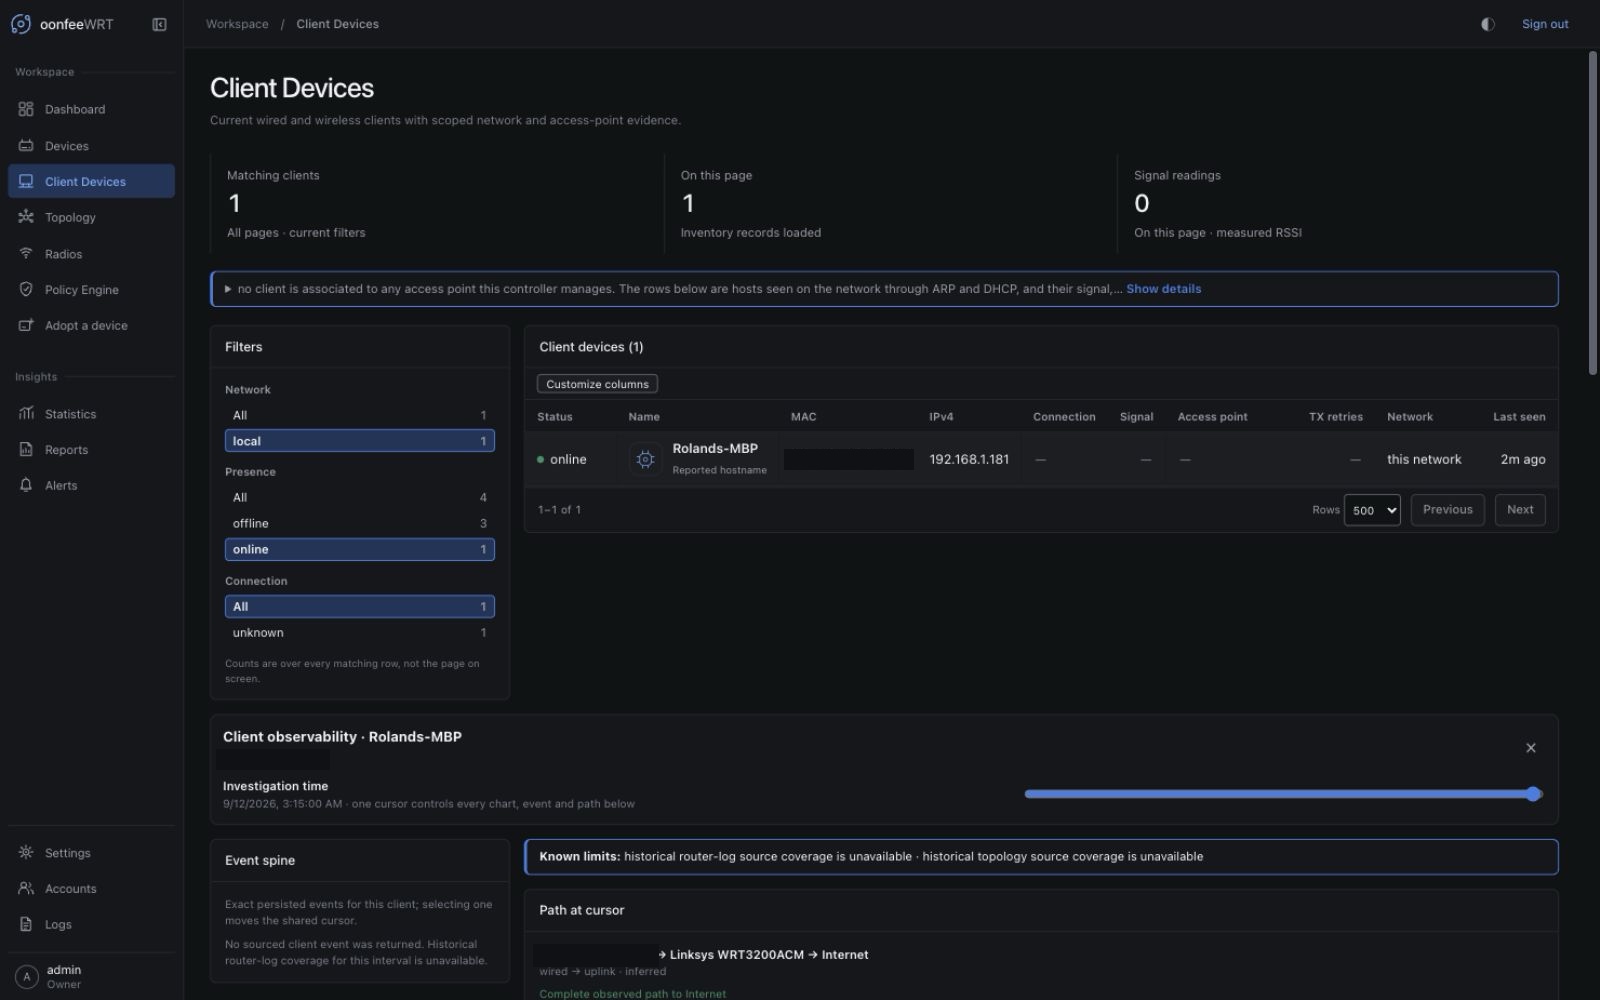
A client investigation sequence
- Confirm the client identity, including MAC randomization possibility.
- Check whether presence is current and which source asserted it.
- Identify the managed network and AP/device attribution.
- Move the shared cursor to the reported incident time.
- Correlate signal/traffic data with AP/device and site health.
- Read events immediately before and after the change.
- Open Topology at the same time when the infrastructure path may have moved.
- Record unavailable evidence as a limitation in the conclusion.
Current topology
Open Topology to view nodes and active link intervals. Sources can include:
- client wireless associations;
- bridge forwarding-database observations;
- neighbour data;
- default-route/uplink evidence;
- optional LLDP.
Each edge includes a confidence and medium. Confidence describes the evidence, not the importance of the device.
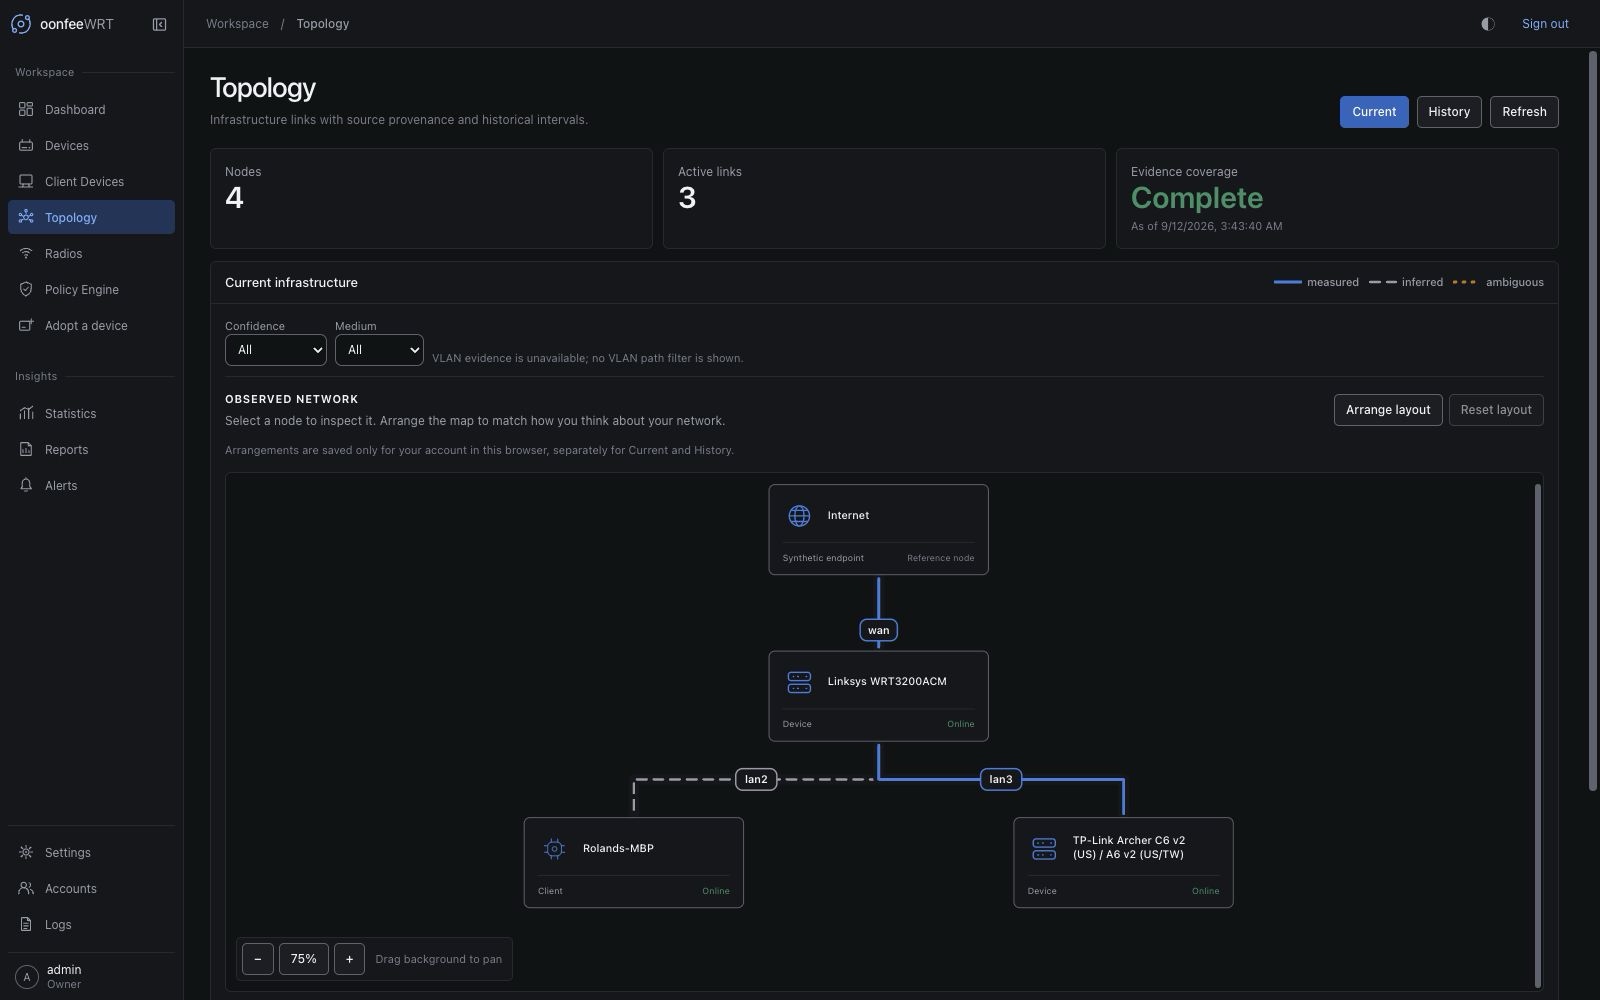
For the Internet edge, the selector introduced in v0.1.3 chooses the unique usable lowest-metric IPv4 default in the installed main table and maps it to one active OpenWrt logical interface. The edge's port is the runtime kernel device, such as pppoe-wan; expanded evidence can also show the different logical interface, such as wan. These are two names for one proved uplink, not duplicate edges.
The same mapping decides whether a neighbour address is Upstream. If route or logical-interface evidence is unavailable or ambiguous, oonfeeWRT preserves the last proved network cache but reports the current source failure instead of reclassifying from interface names.
How v0.1.4 projects a multi-hop wired path
Bridge FDB entries describe where a MAC was seen, not necessarily where its device is plugged in. For example, a Gateway can see an AP's downstream client MAC through the AP-facing port while the AP reports the client's direct placement. Drawing both observations as direct attachments would put one client under two managed devices.
The current view therefore applies a source-aware presentation projection:
- FDB, STP port mapping, and LLDP identify when an FDB row may be transit evidence through a physical link to another managed device.
- A matching direct association, LLDP, or physical FDB placement can suppress that redundant candidate only while the complete managed-device path and every source needed to prove it are fresh.
- The same rule follows more than one managed hop, so a client behind an AP and downstream switch is not also drawn directly under each upstream node.
- The candidate interval is not deleted or rewritten. Historical mode retains the raw interval and evidence that the controller actually observed.
- If the direct placement closes or any required source becomes stale, fails, or is ambiguous, the possible transit candidate becomes visible again. The graph exposes uncertainty instead of extending an old proof.
A clean physical FDB-only placement is labelled inferred, not measured. Stock BusyBox brctl showmacs often cannot report VLAN identity; v0.1.4 records that fact as neutral vlan_available=false metadata rather than adding a warning to every otherwise clean edge. Missing port mapping, unknown medium, competing parents, or conflicting identities still remain explicit gaps or ambiguities.
Filter and inspect
Use the controls to filter by:
- confidence;
- medium;
- VLAN;
- current versus historical mode;
- selected historical time/range.
Zoom changes the visual workspace only. The accessible topology details and complete interval table preserve the underlying information for keyboard and screen-reader use.
Select a node to open its identity or device workspace. For exact edge source, time range, confidence, port, and ambiguity evidence, use the Accessible topology details table and expand its Evidence cell. When duplicate names exist, use the stable device/node identity rather than the label alone.
Arrange the map
- Open Topology and choose Current or History.
- Select Arrange layout. Drag a node to move its drawing. Selecting it outside arrangement mode still opens its details.
- For keyboard control, focus a node and use the arrow keys. Hold Shift for a smaller step. Alternatively choose Node to arrange and use the four labeled direction buttons below it.
- Press Escape to cancel an unfinished drag. Completed moves save locally when browser storage is available; Done arranging returns to inspection.
- Use Reset layout to discard this account's arrangement for the selected mode and restore the automatic placement.
Positions belong to the authenticated account and controller origin in this browser, with separate Current and History arrangements. They are not shared with another account, synced between browsers, written to a router, or included in a controller backup. Clearing site data removes them. If storage is blocked, arranging still works for the current view and the UI explains that it cannot save the preference.
Filters hide evidence without inventing a new placement. New nodes receive an automatic position; removed nodes are ignored. A saved position is discarded when a node changes between placed and unplaced. Unplaced nodes stay in their separate lane, even while arranging. Moving a node cannot make an inferred link measured, reconnect an offline client, or create a cable or VM relationship.
The confidence legend, source details, interval table, and expired last-known placements remain available alongside the graphics. Node status and attachment evidence answer different questions: an online device can still be unplaced.
Historical topology
Historical mode answers what links did the controller have evidence for at a given time? It does not reconstruct packets or invent missing intervals.
Choose a preset or custom range. The view uses interval semantics: a link is present when its evidence interval overlaps the selected time. A last-known placement may be shown separately from a currently supported link.
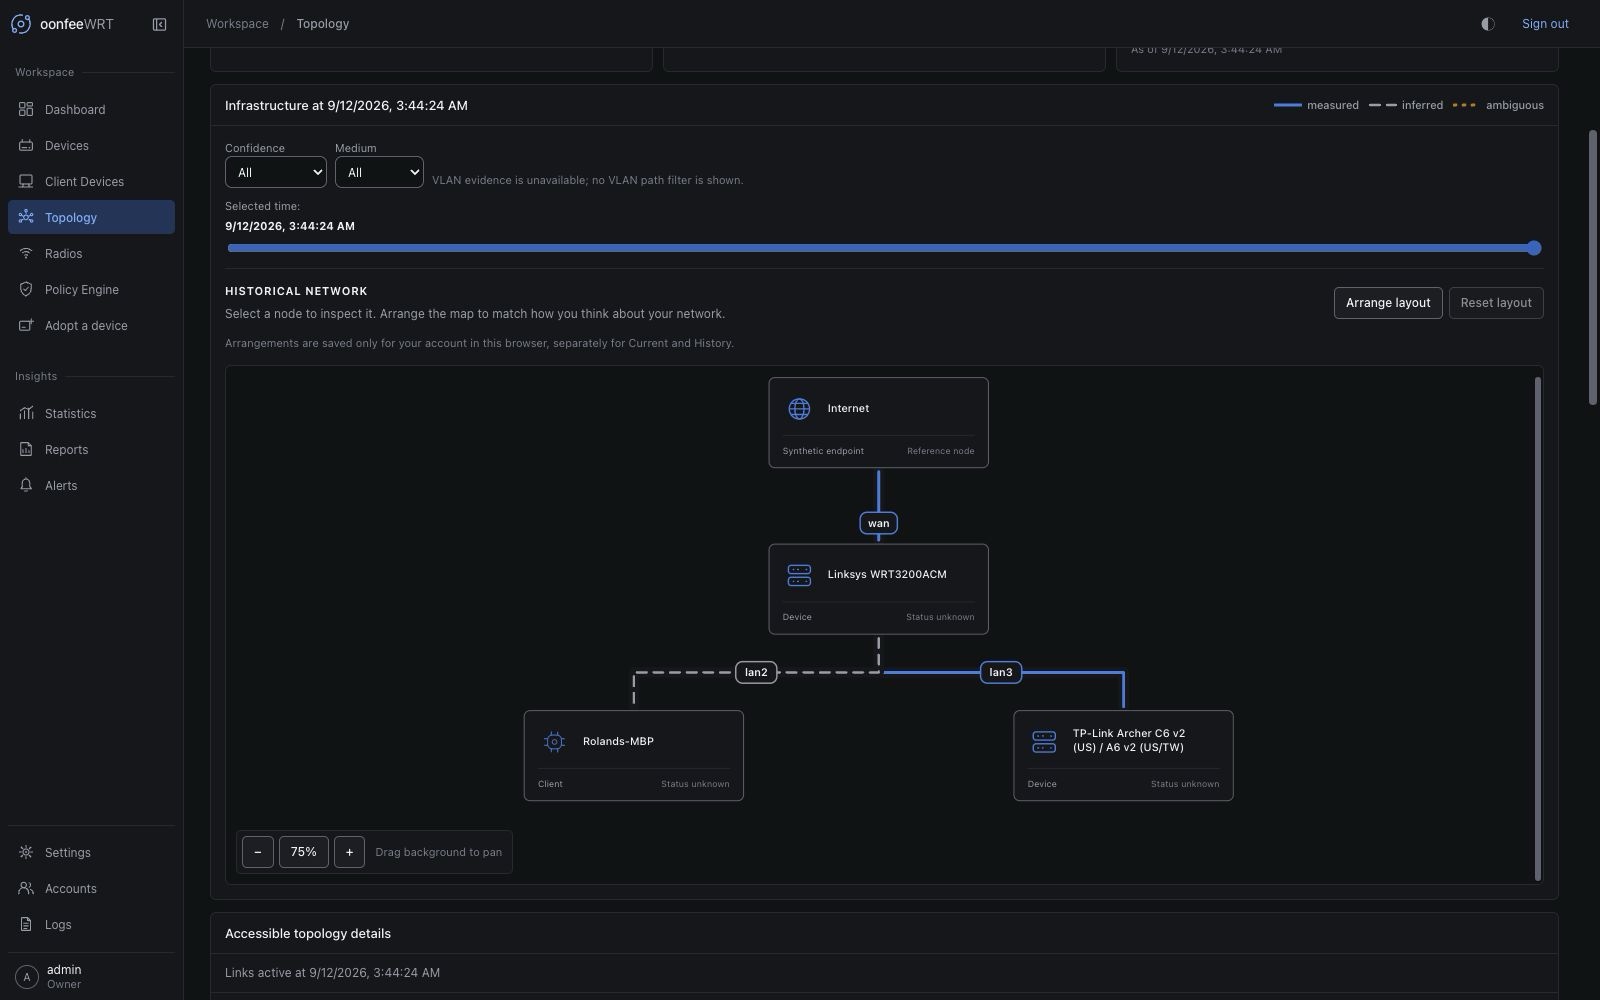
Topology history is retained for 31 days. A request near or beyond that bound can be marked retention-truncated. Export or record incident evidence before the window expires when it must be kept longer.
Evidence coverage and LLDP
The coverage indicator accounts for every adopted device relevant to the current request. One device with stale/unreadable topology sources makes the fleet view incomplete; oonfeeWRT does not hide that by drawing only the easier links.
LLDP can strengthen direct infrastructure adjacency evidence. It remains optional because enabling it may install the official OpenWrt lldpd package and configure physical interfaces. Review the exact package and interface plans on the device page, and retain the rollback ledger.
LLDP can also establish which managed peer is on an FDB-observing physical port, which helps the current-view projection recognize transit evidence. It does not replace client association, FDB, neighbour, STP, or route evidence; each source answers a different question and must still be fresh.
Troubleshooting clients
| Symptom | Likely explanation | Action |
|---|---|---|
| Client missing from current list | Presence expired, device poll failed, client out of scope, or randomized identity | Clear filters, check source coverage/device state, and compare MAC/hostname evidence |
| Wireless client attributed to wrong AP | Stale station data or simultaneous/ambiguous evidence | Check timestamp and association history; wait for fresh evidence rather than editing inventory |
| Wired neighbour appears on uplink | It is on the subnet carrying the default route, not a managed LAN client | Review network scoping and topology source; do not count it as a client merely because ARP saw it |
| Metrics are blank | Focused source has not flushed or hardware does not expose it | Leave the client/device view focused through the next collection/rollup and read the source note |
Troubleshooting topology
| Symptom | Likely explanation | Action |
|---|---|---|
| No edge between known devices | No shared fresh source proves adjacency | Inspect coverage gaps; add LLDP only if its footprint is justified |
| Edge confidence is lower than expected | Inference comes from FDB/neighbour/association rather than direct LLDP | Expand the edge's Evidence cell in the accessible table and base the conclusion on the named source |
| Client or device appears directly below multiple managed parents | Required direct-path, physical-port, or source-freshness proof is missing or ambiguous, so a possible transit observation cannot be hidden safely | Expand every candidate edge and source gap; wait for a complete fresh topology cycle, and use LLDP only if stronger adjacency evidence justifies its package/configuration footprint |
| An upstream candidate reappears after previously disappearing | The direct placement closed, or one source in the multi-hop proof became stale, failed, or ambiguous | Treat the reappearing edge as uncertainty rather than a move until fresh evidence establishes one placement |
| FDB edge says inferred but has no VLAN warning | Clean FDB-only evidence supports placement, while stock BusyBox did not report VLAN provenance | Read vlan_available in Evidence; do not promote the edge to measured or invent a VLAN, but do not treat absent provenance alone as a broken source |
| Historical device is unplaced | Device existed but no edge interval supports placement at that time | Use last-known placement as context, not as a historical fact |
| History ends early | 31-day retention bound or missing collection interval | Read the truncation/gap notice and preserve future incidents earlier |
| Duplicate node names | Devices share display names or defaults | Rename controller display identities and use stable IDs during review |
| Internet edge is missing | No current main-table IPv4 default, equal-metric distinct defaults, multipath/ECMP, failed composite source, or no unique logical-interface mapping | Expand source coverage, correct the route or interface evidence, and wait for the next network/topology cycle; do not infer an edge from a wan name |
Uplink port says pppoe-wan while the network says wan | Topology displays the proved kernel counter device and evidence retains the logical OpenWrt interface | Treat them as one mapped uplink and use pppoe-wan when checking runtime counters |